4.1 Statistics are calculated for samples; they are usually symbolized by Latin letters (e.g., M). Parameters are calculated for populations; they are usually symbolized by Greek letters (e.g., μ).
4.2 It has the greatest effect on the mean, because the calculation of the mean takes into account the numeric value of each data point, including that outlier.
4.3
a.M =
= (10 + 8 + 22 + 5 + 6 + 1 + 19 + 8 + 13 + 12 + 8)/11 = 112/11 = 10.18 The median is found by arranging the scores in numeric order—1, 5, 6, 8, 8, 8, 10, 12, 13, 19, 22—then dividing the total number of scores, 11, by 2 and adding 1/2 to get 6. The 6th score in our ordered list of scores is the median, and in this case the 6th score is the number 8. The mode is the most common score. In these data, the score 8 occurs most often (three times), so 8 is our mode.
b.M =
= (122.5 + 123.8 + 121.2 + 125.8 + 120.2 + 123.8 + 120.5 + 119.8 + 126.3 + 123.6)/10 = 1227.5/10 = 122.75 The data ordered are: 119.8, 120.2, 120.5, 121.2, 122.5, 123.6, 123.8, 123.8, 125.8, 126.3. Again, we find the median by ordering the data and then dividing the number of scores (here there are 10 scores) by 2 and adding 1/2. In this case, we get 5.5, so the mean of the 5th and 6th data points is the median. The median is (122.5 + 123.6)/2 = 123.05. The mode is 123.8, which occurs twice in these data.
c.M =
= (0.100 + 0.866 + 0.781 + 0.555 + 0.222 + 0.245 + 0.234)/7 = 3.003/7 = 0.429. Note that three decimal places are included here (rather than the standard two places used throughout this book) because the data are carried out to three decimal places. The median is found by first ordering the data: 0.100, 0.222, 0.234, 0.245, 0.555, 0.781, 0.866. Then the total number of scores, 7, is divided by 2 to get 3.5, to which 1/2 is added to get 4. So, the 4th score, 0.245, is the median. There is no mode in these data. All scores occur once.
b. In this case, the scores would comprise a sample taken from the whole population, and this mean would be a statistic. The symbol, therefore, would be either M or
.
c. In this case, the scores would constitute the entire population of interest, and the mean would be a parameter. Thus, the symbol would be μ.
d. To find the median, we would arrange the scores in order: 0, 0, 1, 1, 1, 1, 2, 2, 2, 2, 2, 2, 3, 3, 3, 3, 4, 5, 6, 7. We would then divide the total number of scores, 20, by 2 and add 1/2, which is 10.5. The median, therefore, is the mean of the 10th and 11th scores. Both of these scores are 2; therefore, the median is 2.
e. The mode is the most common score—in this case, there are six 2’s, so the mode is 2.
f. The mean is a little higher than the median. This indicates that there are potential outliers pulling the mean higher; outliers would not affect the median.
4.5 By incorrectly labeling the debate as a regular edition of the newsmagazine program, the mean number of viewers for the show would be much higher as a result of the outlier from this special programming event, thus resulting in more advertising dollars for NBC.
4.6 Variability is the concept of variety in data, often measured as deviation around some center.
4.7 The range tells us the span of the data, from highest to lowest score. It is based on just two scores. The standard deviation tells us how far the typical score falls from the mean. The standard deviation takes every score into account.
4.8
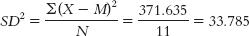
a. The range is: Xhighest − Xlowest = 22 − 1 = 21 The variance is: We start by calculating the mean, which is 10.182. We then calculate the deviation of each score from the mean and the square of that deviation.
X
X − M
(X − M)2
10
−0.182
0.033
8
−2.182
4.761
22
11.818
139.665
5
−5.182
26.853
6
−4.182
17.489
1
−9.182
84.309
19
8.818
77.757
8
−2.182
4.761
13
2.818
7.941
12
1.818
3.305
8
−2.182
4.761
The standard deviation is:
or
b. The range is: Xhighest − Xlowest = 126.3 − 119.8 = 6.5 The variance is: We start by calculating the mean, which is 122.750. We then calculate the deviation of each score from the mean and the square of that deviation.
X
X − M
(X − M)2
122.500
−0.250
0.063
123.800
1.050
1.103
121.200
−1.550
2.403
125.800
3.050
9.303
120.200
−2.550
6.503
123.800
1.050
1.103
120.500
−2.250
5.063
119.800
−2.950
8.703
126.300
3.550
12.603
123.600
0.850
0.723
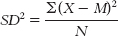
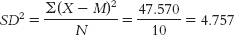
The standard deviation is:
or
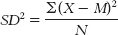
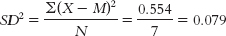
c. The range is: Xhighest − Xlowest = 0.866 − 0.100 = 0.766 The variance is: We start by calculating the mean, which is 0.429. We then calculate the deviation of each score from the mean and the square of that deviation.
X
X − M
(X − M)2
0.100
−0.329
0.108
0.866
0.437
0.191
0.781
0.352
0.124
0.555
0.126
0.016
0.222
−0.207
0.043
0.245
−0.184
0.034
0.234
−0.195
0.038
The standard deviation is:
or
4.9
a. range = Xhighest − Xlowest = 1460 − 450 = 1010
b. We do not know whether scores cluster at some point in the distribution—for example, near one end of the distribution—or whether the scores are more evenly spread out.
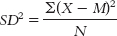
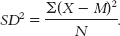
c. The formula for variance is
. The first step is to calculate the mean, which is 927.500. We then create three columns: one for the scores, one for the deviations of the scores from the mean, and one for the squares of the deviations.
X
X − M
(X − M)2
450
−477.50
228,006.25
670
−257.50
66,306.25
1130
202.50
41,006.25
1460
532.50
283,556.25
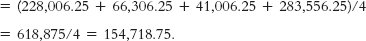
We can now calculate variance:
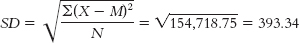
d. Standard deviation is calculated just like we calculated variance, but we then take the square root.
e. If the researcher were interested only in these four students, these scores would represent the entire population of interest, and the variance and standard deviation would be parameters. Therefore, the symbols would be σ2 and σ, respectively.
f. If the researcher hoped to generalize from these four students to all students at the university, these scores would represent a sample, and the variance and standard deviation would be statistics. Therefore, the symbols would be SD2, s2, or MS for variance and SD or s for standard deviation.
 = (10 + 8 + 22 + 5 + 6 + 1 + 19 + 8 + 13 + 12 + 8)/11 = 112/11 = 10.18
 = (122.5 + 123.8 + 121.2 + 125.8 + 120.2 + 123.8 + 120.5 + 119.8 + 126.3 + 123.6)/10 = 1227.5/10 = 122.75
 = (0.100 + 0.866 + 0.781 + 0.555 + 0.222 + 0.245 + 0.234)/7 = 3.003/7 = 0.429.
 = (1 + 0 + 1 + 2 + 5 +…4 + 6)/20 = 50/20 = 2.50
 .
.
 or
or 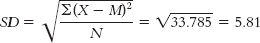
 or
or 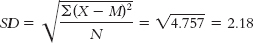
 or
or 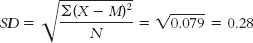
 .
.