Chapter 6
- 6.1 Unimodal means there is one mode or high point to the curve. Symmetric means the left and right sides of the curve have the same shape and are mirror images of each other.
- 6.2
- a.

- b.

- a.
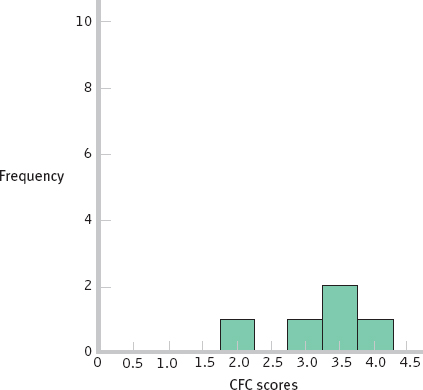
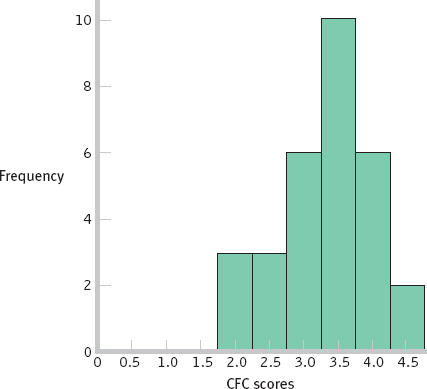
- 6.3 The shape of the distribution becomes more normal as the size of the sample increases (although the larger sample appears to be somewhat negatively skewed).
- 6.4 In standardization, we convert individual scores to standardized scores for which we know the percentiles.
- 6.5 The numeric value tells us how many standard deviations a score is from the mean of the distribution. The sign tells us whether the score is above or below the mean.
- 6.6
- a.

- b.

- a.
- 6.7
- a. X = z(σ) + μ = 2(2.5) + 14 = 19
- b. X = z(σ) + μ = −1.4(2.5) + 14 = 10.5
- 6.8
- a.
 ; approximately 16% of students have a CFC score of 2.5 or less.
 - b.
 ; this score is at approximately the 98th percentile.
 - c. This student has a z score of 1.
- d. X = z(σ) + μ = 1(0.70) + 3.20 = 3.90; this answer makes sense because 3.90 is above the mean of 3.20, as a z score of 1 would indicate.
- a.
- 6.9
- a. Nicole is in better health because her score is above the mean for her measure, whereas Samantha’s score is below the mean.
- b. Samantha’s z score is

Nicole’s z score is
Nicole is in better health, being 1 standard deviation above the mean, whereas Samantha is 2 standard deviations below the mean. - c. We can conclude that approximately 98% of the population is in better health than Samantha, who is 2 standard deviations below the mean. We can conclude that approximately 16% of the population is in better health than Nicole, who is 1 standard deviation above the mean.
- 6.10 The central limit theorem asserts that a distribution of sample means approaches the shape of the normal curve as sample size increases. It also asserts that the spread of the distribution of sample means gets smaller as the sample size gets larger.
- 6.11 A distribution of means is composed of many means that are calculated from all possible samples of a particular size from the same population.
- 6.12

- 6.13
- a. The scores range from 2.0 to 4.5, which gives us a range of 4.5 − 2.0 = 2.5.
- b. The means are 3.4 for the first row, 3.4 for the second row, and 3.15 for the third row [e.g., for the first row, M = (3.5 + 3.5 + 3.0 + 4.0 + 2.0 + 4.0 + 2.0 + 4.0 + 3.5 + 4.5)/10 = 3.4]. These three means range from 3.15 to 3.40, which gives us a range of 3.40 − 3.15 = 0.25.
- c. The range is smaller for the means of samples of 10 scores than for the individual scores because the more extreme scores are balanced by lower scores when samples of 10 are taken. Individual scores are not attenuated in that way.
- d. The mean of the distribution of means will be the same as the mean of the individual scores: μM = μ = 3.32. The standard error will be smaller than the standard deviation; we must divide by the square root of the sample size of 10:

D-