Chapter 10 SPSS®
For a paired-samples t test, let’s use the data from this chapter on performance using a small monitor versus a large monitor. Enter the data in two columns, with each participant having one score in the first column for his or her performance on the small monitor and one score in the second column for his or her performance on the large monitor.
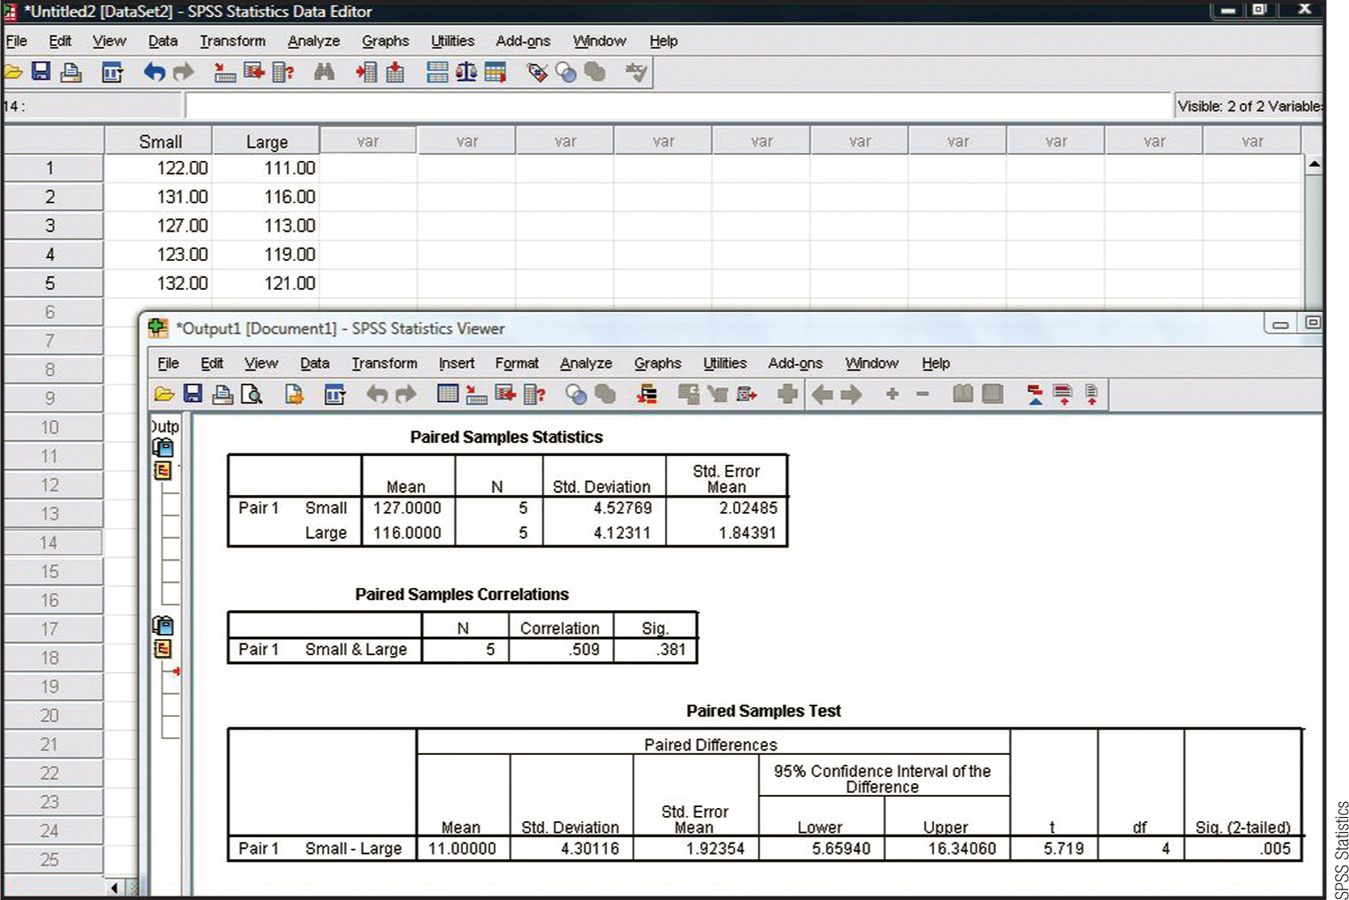
Select Analyze → Compare Means → Paired-Samples T Test. Choose the dependent variable under the first condition (small) by clicking it, then clicking the center arrow. Choose the dependent variable under the second condition (large) by clicking it, then clicking the center arrow. Then click “OK.” The data and output are shown in the screenshot. Notice that the t statistic and confidence interval match ours (5.72 and [−16.34, −5.66]) except that the signs are different. This occurs because of the order in which one score was subtracted from the other score—that is, whether the score on the large monitor was subtracted from the score on the small monitor, or vice versa. The outcome is the same in either case. The p value is under “Sig. (2-tailed)” and is .005.