Chapter 12 Exercises
Clarifying the Concepts
Question 12.1
What is an ANOVA?
Question 12.2
What do the F distributions allow us to do that the t distributions do not?
Question 12.3
The F statistic is a ratio of between-
Question 12.4
What is the difference between a within-
Question 12.5
What are the three assumptions for a between-
Question 12.6
The null hypothesis for ANOVA posits no difference among population means, as in other hypothesis tests, but the research hypothesis in this case is a bit different. Why?
Question 12.7
Why is the F statistic always positive?
Question 12.8
In your own words, define the word source as you would use it in everyday conversation. Provide at least two different meanings that might be used. Then define the word as a statistician would use it.
Question 12.9
Explain the concept of sum of squares.
Question 12.10
The total sum of squares for a one-
Question 12.11
What is the grand mean?
Question 12.12
How do we calculate the between-
Question 12.13
What do we typically use to measure effect size for a z test or a t test? What do we use to measure effect size for an ANOVA?
Question 12.14
What are Cohen’s conventions for interpreting effect size using R2?
Question 12.15
What does post hoc mean, and when are these tests needed with ANOVA?
Question 12.16
Define the symbols in the following formula: 
.
Question 12.17
Find the error in the statistics language in each of the following statements about z, t, or F distributions or their related tests. Explain why it is incorrect and provide the correct word.
The professor reported the mean and standard error for the final exam in the statistics class.
Before we can calculate a t statistic, we must know the population mean and the population standard deviation.
The researcher calculated the parameters for her three samples so that she could calculate an F statistic and conduct an ANOVA.
For her honors project, Evelyn calculated a z statistic so that she could compare the mean video game performance scores of a sample of students who had ingested caffeine and a sample of students who had not ingested caffeine.
Question 12.18
Find the incorrectly used symbol or symbols in each of the following statements or formulas. For each statement or formula, (i) state which symbol(s) is/are used incorrectly, (ii) explain why the symbol(s) in the original statement is/are incorrect, and (iii) state what symbol(s) should be used.
When calculating an F statistic, the numerator includes the estimate for the between-
groups variance, s. SSbetween = (X − GM)2
SSwithin = (X − M)
F =

Question 12.19
What are the necessary steps for performing a Bonferroni post hoc comparison?
320
Calculating the Statistics
Question 12.20
For the following data, assuming a between-
Group 1: 11, 17, 22, 15
Group 2: 21, 15, 16
Group 3: 7, 8, 3, 10, 6, 4
Group 4: 13, 6, 17, 27, 20
dfbetween
dfwithin
dftotal
The critical value, assuming a p value of 0.05
The mean for each group and the grand mean
The total sum of squares
The within-
groups sum of squares The between-
groups sum of squares The rest of the ANOVA source table for these data
Tukey HSD values
Question 12.21
For the following data, assuming a between-
1990: 45, 211, 158, 74
2000: 92, 128, 382
2010: 273, 396, 178, 248, 374
dfbetween
dfwithin
dftotal
The critical value, assuming a p value of 0.05
The mean for each group and the grand mean
The total sum of squares
The within-
groups sum of squares The between-
groups sum of squares The rest of the ANOVA source table for these data
The effect size and an indication of its size
Question 12.22
Calculate the F statistic, writing the ratio accurately, for each of the following cases:
Between-
groups variance is 29.4 and within- groups variance is 19.1 Within-
groups variance is 0.27 and between- groups variance is 1.56 Between-
groups variance is 4595 and within- groups variance is 3972
Question 12.23
Calculate the F statistic, writing the ratio accurately, for each of the following cases:
Between-
groups variance is 321.83 and within- groups variance is 177.24 Between-
groups variance is 2.79 and within- groups variance is 2.20 Within-
groups variance is 41.60 and between- groups variance is 34.45
Question 12.24
An incomplete one-
| Source | SS | df | MS | F |
|---|---|---|---|---|
| Between | 191.450 | — | 47.863 | — |
| Within | 104.720 | 32 | — | |
| Total | — | 36 |
Question 12.25
An incomplete one-
| Source | SS | df | MS | F |
|---|---|---|---|---|
| Between | — | 2 | — | — |
| Within | 89 | 11 | — | |
| Total | 132 | — |
Question 12.26
Each of the following is a calculated F statistic with its degrees of freedom. Using the F table, estimate the level of significance for each. You can do this by indicating whether its likelihood of occurring is greater than or less than a p level shown on the table.
F = 4.11, with 3 dfbetween and 30 dfwithin
F = 1.12, with 5 dfbetween and 83 dfwithin
F = 2.28, with 4 dfbetween and 42 dfwithin
Question 12.27
A researcher designs an experiment in which the single independent variable has four levels. If the researcher performed an ANOVA and rejected the null hypothesis, how many post hoc comparisons would she make (assuming she was making all possible comparisons)?
Question 12.28
A researcher designs an experiment in which the single independent variable has five levels. If the researcher performed an ANOVA and rejected the null hypothesis, how many post hoc comparisons would he make (assuming he was making all possible comparisons)?
Question 12.29
A researcher designs an experiment in which the single independent variable has seven levels. If the researcher performed an ANOVA and rejected the null hypothesis, how many post hoc comparisons would she make (assuming she was making all possible comparisons)?
Question 12.30
Consider the abbreviated version of the study by Irwin and colleagues (2004) that we analyzed in How It Works 12.1. Assume we decide to do Bonferroni post hoc comparisons rather than use Tukey’s HSD.
With a desired p level of 0.05 overall, what would the cutoff p value be for each comparison using a Bonferroni test?
With a desired p level of 0.01 overall, what would the cutoff p value be for each comparison using a Bonferroni test?
Using statistical software, we performed all of the possible pairwise independent-
samples t tests; the actual p values (listed in the Sig. column in SPSS) associated with each of those tests appears below. Assuming an overall p level of 0.05, decide whether to reject or fail to reject the null hypothesis for each comparison. <5 versus 5–
8: p = 0.041 <5 versus 9–
12: p = 0.001 5–
8 versus 9– 12: p = 0.060
Applying the Concepts
Question 12.31
Comedy versus news and hypothesis testing: Focusing on coverage of the 2004 U.S. presidential election, Julia R. Fox, a telecommunications professor at Indiana University, wondered whether The Daily Show, despite its comedy format, was a valid source of news. She coded a number of half-
As the study is described, what are the independent and dependent variables? For nominal variables, state the levels.
As the study is described, what type of hypothesis test would Fox use?
Now imagine that Fox added a third category, a cable news channel such as CNN. Based on this new information, state the independent variable or variables and the levels of any nominal independent variables. What hypothesis test would she use?
Question 12.32
The comparison distribution: For each of the following situations, state whether the distribution of interest is a z distribution, a t distribution, or an F distribution. Explain your answer.
A city employee locates a U.S. Census report that includes the mean and standard deviation for income in the state of Wyoming and then takes a random sample of 100 residents of the city of Cheyenne. He wonders whether residents of Cheyenne earn more, on average, than Wyoming residents as a whole.
A researcher studies the effect of different contexts on work interruptions. Using discreet video cameras, she observes employees working in enclosed offices in the workplace, in open cubicles in the workplace, and in home offices.
An honors student wondered whether an education in statistics reduced the tendency to believe advertising that cited data. He compared social science majors who had taken statistics and social science majors who had not taken statistics with respect to their responses to an interactive advertising assessment.
Question 12.33
The comparison distribution: For each of the following situations, state whether the distribution of interest is a z distribution, a t distribution, or an F distribution. Explain your answer.
A student reads in her Introduction to Psychology textbook that the mean IQ is 100. She asks 10 friends what their IQ scores are (they attend a university that assesses everyone’s IQ score) to determine whether her friends are smarter than average.
Is the presence of books in the home a marker of a stable family? A social worker counted the number of books on view in the living rooms of all the families he visited over the course of one year. He categorized families into four groups: no books visible, only children’s books visible, only adult books visible, and both children’s and adult books visible. The department for which he worked had stability ratings for each family based on a number of measures.
Which television show leads to more learning? A researcher assessed the vocabularies of a sample of children randomly assigned to watch Sesame Street as much as they wanted for a year but to not watch The Wiggles. She also assessed the vocabularies of a sample of children randomly assigned to watch The Wiggles as much as they wanted for a year but not to watch Sesame Street. She compared the average vocabulary scores for the two groups.
Question 12.34
Links among distributions: The z, t, and F distributions are closely linked. In fact, it is possible to use an F distribution in all cases in which a t or a z could be used.
If you calculated an F statistic of 4.22 but you could have used a t statistic (i.e., the situation met all criteria for using a t statistic), what would the t statistic have been? Explain your answer.
If you calculated an F statistic of 4.22 but you could have used a z statistic, what would the z statistic have been? Explain your answer.
If you calculated a t statistic of 0.67 but you could have used a z statistic, what would the z statistic have been? Explain your answer.
Cite two reasons that all three types of distributions (i.e., z, t, and F) are still in use when we really only need an F distribution.
Question 12.35
International students and type of ANOVA: Catherine Ruby (2006), a doctoral student at New York University, conducted an online survey to ascertain the reasons that international students chose to attend graduate school in the United States. One of several dependent variables that she considered was reputation; students were asked to rate the importance in their decision of factors such as the reputation of the institution, the institution and program’s academic accreditations, and the reputation of the faculty. Students rated factors on a 1–
322
Ruby compared the importance of reputation among graduate students in different types of programs: arts and sciences, education, law, and business.
Imagine that Ruby followed these graduate students for 3 years and assessed their rating of reputation once a year.
Ruby compared international students working toward a master’s, a doctoral, or a professional degree (e.g., MBA) on reputation.
Imagine that Ruby followed international students from their master’s program to their doctoral program to their postdoctoral fellowship, assessing their ratings of reputation once at each level of their training.
Question 12.36
Type of ANOVA in study of remembering names: Do people remember names better under different circumstances? In a fictional study, a cognitive psychologist studied memory for names after a group activity that lasted 20 minutes. Participants were not told that this was a study of memory. After the group activity, participants were asked to name the other group members. The researcher randomly assigned 120 participants to one of three conditions: (1) group members introduced themselves once (one introduction only), (2) group members were introduced by the experimenter and by themselves (two introductions), and (3) group members were introduced by the experimenter and themselves and also wore name tags throughout the group activity (two introductions and name tags).
Identify the type of ANOVA that should be used to analyze the data from this study.
State what the researcher could do to redesign this study so it would be analyzed with a one-
way within- groups ANOVA. Be specific.
Question 12.37
Political party and ANOVA: Researchers asked 180 U.S. students to identify their political viewpoint as most similar to that of the Republicans, most similar to that of the Democrats, or neither. All three groups then completed a religiosity scale. The researchers wondered whether political orientation affected levels of religiosity, a measure that assesses how religious one is, regardless of the specific religion with which a person identifies.
What is the independent variable, and what are its levels?
What is the dependent variable?
What are the populations and what are the samples?
Would you use a between-
groups or within- groups ANOVA? Explain. Using this example, explain how you would calculate the F statistic.
Question 12.38
Exercise and the Tukey HSD test: In How It Works 12.1, we conducted a one-
<5 sessions: 155, 120, 130
5–
9–
What conclusion did we draw in step 6 of the ANOVA? Why could you not be more specific in your conclusion? That is, why is an additional test necessary when the ANOVA is statistically significant?
Conduct a Tukey HSD test for this example. State your conclusions based on this test. Show all calculations.
If we did not reject the null hypothesis for a particular pair of means, then why can’t we conclude that the two means are the same?
Question 12.39
Grade point average and comparing the t and F distributions: Based on your knowledge of the relation of the t and F distributions, complete the accompanying software output tables. The table for the independent-
What is the F statistic? Show your calculations. (Hint: The “Mean Square” column includes the two estimates of variance used to calculate the F statistic.)
What is the t statistic? Show your calculations. (Hint: Use the F statistic that you calculated in part (a).)
In statistical software output, “Sig.” refers to the actual p level of the statistic. We can compare the actual p level to a cutoff p level such as 0.05 to decide whether to reject the null hypothesis. For the t test, what is the “Sig.”? Explain how you determined this. (Hint: Would we expect the “Sig.” for the independent-
samples t test to be the same as or different from that for the one- way between- groups ANOVA?) 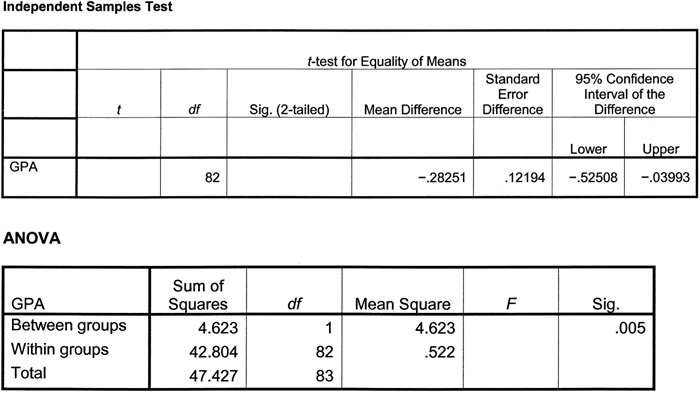
Question 12.40
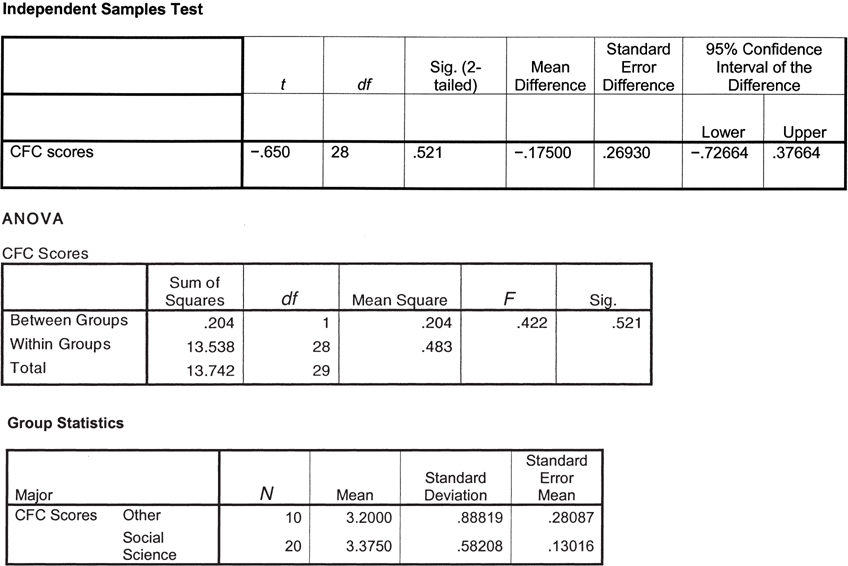
Consideration of Future Consequences and two kinds of hypothesis testing: Two samples of students, one comprised of social science majors and one comprised of students with other majors, completed the Consideration of Future Consequences scale (CFC). The accompanying tables include the output from software for an independent-
324
Demonstrate that the results of the independent-
samples t test and the one- way between- groups ANOVA are the same. (Hint: Find the t statistic for the t test and the F statistic for the ANOVA.) In statistical software output, “Sig.” refers to the actual p level of the statistic. We can compare the actual p level to a cutoff p level such as 0.05 to decide whether to reject the null hypothesis. What are the “Sig.” levels for the two tests here—
the independent- samples t test and the one- way between- groups ANOVA? Are they the same or different? Explain why this is the case. In the CFC ANOVA, the column titled “Mean Square” includes the estimates of variance. Show how the F statistic was calculated from two types of variance. (Hint: Look at the far-
left column to determine which estimate of variance is which.) Looking at the table titled “Group Statistics,” how many participants were in each sample?
Looking at the table titled “Group Statistics,” what is the mean CFC score for the social science majors?
Question 12.41
Instructors on Facebook and one-
What is the independent variable, what kind of variable is it, and what are its levels?
What is the first dependent variable mentioned, and what kind of variable is this?
Is this a between-
groups design or a within- groups design? Explain your answer. Based on your answers to parts (a) through (c), what kind of ANOVA would the researchers use to analyze the data? Explain your answer.
Is this a true experiment? Explain your answer, and explain what this means for the researchers’ conclusion.
Question 12.42
Post hoc tests and p values: The most recent version of the Publication Manual of the American Psychological Association (2010) recommends reporting the exact p values for all statistical tests to two decimal places (previously, it recommended reporting p < 0.05 or p > 0.05). Explain how this reporting format allows a reader to more critically interpret the results of post hoc comparisons reported by an author.
Question 12.43
Post hoc tests, bilingualism, and language skills: Researchers Raluca Barac and Ellen Bialystok (2012) conducted a study in which they compared the language skills of 104 six-
What is the independent variable, what kind of variable is it, and what are its levels? What is the dependent variable and what kind of variable is it?
How do we know that this finding is statistically significant?
Why was the one-
way ANOVA not sufficient to draw a conclusion from these data? Explain what is meant here by the Bonferroni test.
Summarize this finding in your own words.
Question 12.44
Romantic love and post hoc tests: Researchers who conducted a study of brain activation and romantic love divided their analyses into two groups (Aron et al., 2005). Some analyses—
Explain why the researchers’ plan to have different p levels for the two groups was a wise one.
Suggest one method by which the researchers could have come up with a p level of 0.001 as their cutoff.
Putting It All Together
Question 12.45
Trust in leadership and one-
325
Employees with low trust in their leader: 9, 14, 11, 18
Employees with moderate trust in their leader: 14, 35, 23
Employees with high trust in their leader: 27, 33, 21, 34
What is the independent variable? What are its levels?
What is the dependent variable?
Conduct all six steps of hypothesis testing for a one-
way between- groups ANOVA. How would you report the statistics in a journal article?
Conduct a Tukey HSD test. What did you learn?
Why is it not possible to conduct a t test in this situation?
Why is it not possible to use a within-
groups design for this study?
Question 12.46
Orthodontics and one-
Primary school: 16, 13, 18
Junior high school: 8, 13, 14, 12
High school: 20, 15, 16, 18
What is the independent variable? What are its levels?
What is the dependent variable?
Conduct all six steps of hypothesis testing for a one-
way between- groups ANOVA. How would you report the statistics in a journal article?
Conduct a Tukey HSD test. What did you learn?
Calculate the appropriate measure of effect size for this sample.
Based on Cohen’s conventions, is this a small, medium, or large effect size?
Why is it useful to know the effect size in addition to the results of a hypothesis test?
How could this study be conducted using a within-
groups design?