Chapter 14 Exercises
Clarifying the Concepts
Question 14.1
What is a two-
Question 14.2
What is a factor?
Question 14.3
In your own words, define the word cell, first as you would use it in everyday conversation and then as a statistician would use it.
Question 14.4
What is a four-
Question 14.5
What is the difference in information provided when we say two-
Question 14.6
What are the three different F statistics in a two-
Question 14.7
What is a marginal mean?
Question 14.8
What are the three ways to identify a statistically significant interaction?
Question 14.9
How do bar graphs help us identify and interpret interactions? Explain how adding lines to the bar graph can help.
Question 14.10
How do we calculate the between-
Question 14.11
In step 6 of hypothesis testing for a two-
Question 14.12
When are post hoc tests needed for a two-
Question 14.13
Explain the following formula in your own words: SSinteraction = SStotal − (SSrows + SScolumns + SSwithin).
Question 14.14
In your own words, define the word interaction, first as you would use it in everyday conversation and then as a statistician would use it.
Question 14.15
What effect-
Question 14.16
What is a two-
Question 14.17
How is an ANCOVA different from an ANOVA?
Question 14.18
How is a MANOVA different from an ANOVA?
Question 14.19
When might a researcher decide to use a MANOVA rather than an ANOVA?
Question 14.20
When might a researcher decide to use an ANCOVA rather than an ANOVA?
Question 14.21
What is a two-
Calculating the Statistics
Question 14.22
For each of the following scenarios, what are two names for the ANOVA that would be conducted to analyze the data?
A researcher examined the effect of gender and pet ownership (no pets, one pet, more than one pet) on a measure of loneliness.
In a study on memory, participants completed a memory task once each week for 4 weeks—
twice after sleeping 8 hours and twice after sleeping 4 hours. In each sleep condition, the participants completed the task after ingesting a caffeinated beverage and again, on another day, after ingesting a “placebo” beverage that they were told contained caffeine. A study examined the impact of students’ Facebook profiles on numbers of Facebook friends. The researchers were interested in the effect of the profile photo—
either an identifiable photo of the student or a photo of someone or something else— and the effect of relationship status— whether it indicates the student is single or in a relationship.
Question 14.23
Identify the factors and their levels in the following research designs.
Men and women’s enjoyment of two different sporting events, Sport 1 and Sport 2, are compared using a 20-
point enjoyment scale. The amount of underage drinking, as documented in formal incident reports, is compared at “dry” college campuses (no alcohol at all) and “wet” campuses (those that enforce the legal age for possession of alcohol). Three different types of colleges are considered: state institutions, private schools, and schools with a religious affiliation.
The extent of contact with juvenile authorities is compared for youth across three age groups (12–
13, 14– 15, 16– 17), considering both gender and family composition (two parents, single parent, or no identified authority figure).
Question 14.24
State how many cells there should be for each of these studies. Then, create an empty grid to represent those cells.
Men and women’s enjoyment of two different sporting events, Sport 1 and Sport 2, are compared using a 20-
point enjoyment scale. The amount of underage drinking, as documented in formal incident reports, is compared at “dry” college campuses (no alcohol at all) and “wet” campuses (those that enforce the legal age for possession of alcohol). Three different types of colleges are considered: state institutions, private schools, and schools with a religious affiliation.
The extent of contact with juvenile authorities is compared for youth across three age groups (12–
13, 14– 15, 16– 17), considering both gender and family composition (two parents, single parent, or no identified authority figure).
Question 14.25
Use these “enjoyment” data to perform the following:
| Ice Hockey | Figure Skating | |
|---|---|---|
| Men | 19, 17, 18, 17 | 6, 4, 8, 3 |
| Women | 13, 14, 18, 8 | 11, 7, 4, 14 |
Calculate the cell and marginal means.
Draw a bar graph.
Calculate the five different degrees of freedom, and indicate the critical F value based on each set of degrees of freedom, assuming the p level is 0.01.
Calculate the total sum of squares.
Calculate the between-
groups sum of squares for the independent variable gender. Calculate the between-
groups sum of squares for the independent variable sporting event. Calculate the within-
groups sum of squares. Calculate the sum of squares for the interaction.
Create a source table.
Question 14.26
Use these data—
“Dry” campus, state school: 47, 52, 27, 50
“Dry” campus, private school: 25, 33, 31
“Wet” campus, state school: 77, 61, 55, 48
“Wet” campus, private school: 52, 68, 60
Calculate the cell and marginal means. Notice the unequal Ns.
Draw a bar graph.
Calculate the five different degrees of freedom, and indicate the critical F value based on each set of degrees of freedom, assuming the p level is 0.05.
Calculate the total sum of squares.
Calculate the between-
groups sum of squares for the independent variable campus. Calculate the between-
groups sum of squares for the independent variable school. Calculate the within-
groups sum of squares. Calculate the sum of squares for the interaction.
Create a source table.
Question 14.27
Using what you know about the expanded source table, fill in the missing values in the table shown here:
| Source | SS | df | MS | F |
|---|---|---|---|---|
| Gender | 248.25 | 1 | ||
| Parenting style | 84.34 | 3 | ||
| Gender × style | 33.60 | |||
| Within | 1107.2 | 36 | ||
| Total |
Question 14.28
Using the information in the source table provided here, compute R2 values for each effect. Using Cohen’s conventions, explain what these values mean.
| Source | SS | df | MS | F |
|---|---|---|---|---|
| A (rows) | 0.267 | 1 | 0.267 | 0.004 |
| B (columns) | 3534.008 | 2 | 1767.004 | 24.432 |
| A × B | 5.371 | 2 | 2.686 | 0.037 |
| Within | 1157.167 | 16 | 72.323 | |
| Total | 4696.813 | 21 |
Question 14.29
Using the information in the source table provided here, compute R2 values for each effect. Using Cohen’s conventions, explain what these values mean.
| Source | SS | df | MS | F |
|---|---|---|---|---|
| A (rows) | 30.006 | 1 | 30.006 | 0.511 |
| B (columns) | 33.482 | 1 | 33.482 | 0.570 |
| A × B | 1.720 | 1 | 1.720 | 0.029 |
| Within | 587.083 | 10 | 58.708 | |
| Total | 652.291 | 13 |
Applying the Concepts
Question 14.30
Football, eye glare, and ANOVA: In Exercise 13.25 (page 346), we described a Yale University study. Let’s consider a redesign in which researchers randomly assigned 46 participants to place one of three substances below their eyes: black grease, black antiglare stickers, or petroleum jelly. They assessed eye glare using a contrast chart that gives a value for each participant, a scale measure. Black grease led to a reduction in glare compared with the two other conditions, antiglare stickers or petroleum jelly (DeBroff & Pahk, 2003). Imagine that every participant was tested twice, once in broad daylight and again under the artificial lights used at night.
What are the independent variables and their levels?
What kind of ANOVA would we use?
385
Question 14.31
Health-
Explain why this study would be analyzed with a between-
groups ANOVA. How could this study be redesigned to use a within-
groups ANOVA? (Hint: Think long term.)
Question 14.32
Memory and choosing the type of ANOVA: In a fictional study, a cognitive psychologist studied memory for names after a group activity. The researcher randomly assigned 120 participants to one of three conditions: (1) group members introduced themselves once, (2) group members were introduced by the experimenter and by themselves, and (3) group members were introduced by the experimenter and themselves, and they wore name tags throughout the group activity.
How could the researcher redesign this study so it would be analyzed with a two-
way between- groups ANOVA? Be specific. (Note: There are several possible ways that the researcher could do this.) How could the researcher redesign this study so it would be analyzed with a two-
way mixed- design ANOVA? Be specific. (Note: There are several possible ways the researcher could do this.)
Question 14.33
Age, online dating, and choosing the type of ANOVA: A researcher wondered about the degree to which age was a factor for those posting personal ads on Match.com. He randomly selected 200 ads and examined data about the posters (the people who posted the ads). Specifically, for each ad, he calculated the difference between the poster’s age and the oldest acceptable age in a romantic prospect. So, if someone were 23 years old and would date someone as old as 30, his or her score would be 7; if someone were 25 and would date someone as old as 23, his or her score would be −2. The researcher then categorized the scores into male versus female and seeking a same-
List any independent variables, along with the levels.
What is the dependent variable?
What kind of ANOVA would he use?
Now name the ANOVA using the more specific language that enumerates the numbers of levels.
Use your answer to part (d) to calculate the number of cells. Explain how you made this calculation.
Draw a table that depicts the cells of this ANOVA.
Question 14.34
Racism, juries, and interactions: In a study of racism, Nail, Harton, and Decker (2003) had participants read a scenario in which a police officer assaulted a motorist. Half the participants read about an African American officer who assaulted a European American motorist, and half read about a European American officer who assaulted an African American motorist. Participants were categorized based on political orientation: liberal, moderate, or conservative. Participants were told that the officer was acquitted of assault charges in state court but was found guilty of violating the motorist’s rights in federal court. Double jeopardy occurs when an individual is tried twice for the same crime. Participants were asked to rate, on a scale of 1–
The researchers reported the interaction as F(2, 58) = 10.93, p < 0.0001. The means for the liberal participants were 3.18 for those who read about the African American officer and 1.91 for those who read about the European American officer. The means for the moderate participants were 3.50 for those who read about the African American officer and 3.33 for those who read about the European American officer. The means for the conservative participants were 1.25 for those who read about the African American officer and 4.62 for those who read about the European American officer.
Draw a table of cell means that includes the actual means for this study.
Do the reported statistics indicate that there is a significant interaction? If yes, describe the interaction in your own words.
Draw a bar graph that depicts the interaction. Include lines that connect the tops of the bars and show the pattern of the interaction.
Is this a quantitative or qualitative interaction? Explain.
Change the cell mean for the conservative participants who read about an African American officer so that this is now a quantitative interaction.
Draw a bar graph that depicts the pattern that includes the new cell means.
Change the cell means for the moderate and conservative participants who read about an African American officer so that there is now no interaction.
Draw a bar graph that depicts the pattern that includes the new cell means.
Question 14.35
Self-
386
What are the independent variables and their levels? What is the dependent variable?
What kind of ANOVA did the researchers conduct?
Do the reported statistics indicate that there is a significant interaction? Explain your answer.
Draw a table that includes the cells of the study. Include the cell means.
Draw a bar graph that depicts these findings.
Describe the pattern of the interaction in words. Is this a qualitative or a quantitative interaction? Explain your answer.
Draw a new table of cells, but change the means for male participants reading about women so that there is now a quantitative, rather than a qualitative, interaction.
Draw a bar graph of the means in part (g).
Draw a new table of cells, but change the means for male participants reading about women so that there is no interaction.
Question 14.36
Gender, negotiating a salary, and an interaction: Eleanor Barkhorn (2012) reported in the Atlantic about differences in women’s and men’s negotiating styles. She first explained that researchers did not find a significant difference in how likely women and men are to negotiate salaries. But this did not tell the whole story. Barkhorn wrote: “Women are more likely to negotiate when an employer explicitly says that wages are negotiable. Men, on the other hand, are more likely to negotiate when the employer does not directly state that they can negotiate.”
For each of the following, state whether the finding is a result of examining a main effect or examining an interaction. Explain your answer.
The finding that women and men do not significantly differ, on average, in their likelihood of negotiating.
The finding of a gender difference in the circumstances under which one will negotiate.
Question 14.37
The cross-
The researchers reported two effects, one for the race of the people in the pictures, F(1, 136) = 23.06, p < 0.001, and one for the interaction of the race of the people in the pictures and the instructions, F(1, 136) = 5.27, p < 0.05. When given no instructions, the mean recognition scores were 1.46 for white faces and 1.04 for black faces. When given instructions to pay attention to distinguishing features, the mean recognition scores were 1.38 for white faces and 1.23 for black faces.
What are the independent variables and their levels? What is the dependent variable?
What kind of ANOVA did the researchers conduct?
Do the reported statistics indicate that there is a significant main effect? If yes, describe it.
Why is the main effect not sufficient in this situation to understand the findings? Be specific about why the main effect is misleading by itself.
Do the reported statistics indicate that there is a significant interaction? Explain your answer.
Draw a table that includes the cells of the study and the cell means.
Draw a bar graph that depicts these findings.
Describe the pattern of the interaction in words. Is this a qualitative or a quantitative interaction? Explain your answer.
Question 14.38
Grade point average, fraternities, sororities, and two-
Men in a fraternity: 2.6, 2.4, 2.9, 3.0
Men not in a fraternity: 3.0, 2.9, 3.4, 3.7, 3.0
Women in a sorority: 3.1, 3.0, 3.2, 2.9
Women not in a sorority: 3.4, 3.0, 3.1, 3.1
What are the independent variables and their levels? What is the dependent variable?
Draw a table that lists the cells of the study design. Include the cell means.
Conduct all six steps of hypothesis testing.
Draw a bar graph for all statistically significant effects.
Is there a significant interaction? If yes, describe it in words and indicate whether it is a qualitative or a quantitative interaction. Explain.
Compute the effect sizes, R2, for the main effects and interaction. Using Cohen’s conventions, interpret the effect-
size values.
Question 14.39
Age, online dating, and two-
25-
25-
25-
25-
What are the independent variables and their levels? What is the dependent variable?
Draw a table that lists the cells of the study design. Include the cell means.
Conduct all six steps of hypothesis testing.
Is there a significant interaction? If yes, describe it in words, indicate whether it is a quantitative or a qualitative interaction, and draw a bar graph.
Compute the effect sizes, R2, for the main effects and interaction. Using Cohen’s conventions, interpret the effect-
size values.
Question 14.40
Helping, payment, and two-
Cash payment, low amount of $0.50: 4, 5, 6, 4
Cash payment, moderate amount of $5.00: 7, 8, 8, 7
Candy payment, low amount valued at $0.50: 6, 5, 7, 7
Candy payment, moderate amount valued at $5.00: 8, 6, 5, 5
What are the independent variables and their levels?
What is the dependent variable?
Draw a table that lists the cells of the study design. Include the cell and marginal means.
Create a bar graph.
Using this graph and the table of cell means, describe what effects you see in the pattern of the data.
Write the null and research hypotheses.
Complete all of the calculations and construct a full source table for these data.
Determine the critical value for each effect at a p level of 0.05.
Make your decisions. Is there a significant interaction? If yes, describe it in words and indicate whether it is a qualitative or a quantitative interaction. Explain.
Compute the effect sizes, R2, for the main effects and interaction. Using Cohen’s conventions, interpret the effect-
size values.
Question 14.41
Helping, payment, and interactions: Expanding on the work of Heyman and Ariely (2004) as described in Exercise 14.40, let’s assume a higher level of payment was included and the following data were collected. (Notice that all data are the same as earlier, with the addition of new data under a high payment amount.)
Cash payment, low amount of $0.50: 4, 5, 6, 4
Cash payment, moderate amount of $5.00: 7, 8, 8, 7
Cash payment, high amount of $50.00: 9, 8, 7, 8
Candy payment, low amount, valued at $0.50: 6, 5, 7, 7
Candy payment, moderate amount, valued at $5.00: 8, 6, 5, 5
Candy payment, high amount, valued at $50.00: 6, 7, 7, 6
What are the independent variables and their levels? What is the dependent variable?
Draw a table that lists the cells of the study design. Include the cell and marginal means.
Create a new bar graph of these data.
Do you think there is a significant interaction? If yes, describe it in words.
Now that one independent variable has three levels, what additional analyses are needed? Explain what you would do and why. Based on the graph you created, where do you think there would be significant differences?
388
Question 14.42
Exercise, well-
What type of ANOVA would the researchers conduct?
The researchers included two covariates related to the physical effects of exercise, measures of hemoglobin and serum ferritin. What statistical test would they use? Explain.
The researchers conducted separate analyses for three dependent variables: perceived fatigue, psychological distress, and positive well-
being. If they wanted to include all three dependent variables in the analysis described in part (a), what statistical test would they use? Explain. If the researchers wanted to use all three dependent variables in the analysis described in part (b), the analysis that included covariates, what statistical test would they use? Explain.
Question 14.43
Body weight, salary, and the need for covariates: A nutritional software program called DietPower offers encouragement to its users when they sign in each day. In one instance, the program states that people at their ideal body weight tend to have higher salaries than do people who are overweight and then explicitly states that losing weight might lead to an increase in pay!
Why is this a problematic statement? List at least two confounding variables that might affect this finding.
Imagine that you were going to conduct a study that compared the salaries of two groups: people who were overweight and people who were at their ideal body weight. Why would it be useful to include one or more covariates? What scale variables might you include as covariates?
Question 14.44
Math performance and type of ANOVA: Imagine that a college professor is interested in the effects of a new instructional method on the math performance of first-
What is the independent variable and what are its levels?
What scale variable could the professor use as a covariate in the statistical analysis of this study?
What are the dependent variables assessed by the professor?
What type of ANOVA could be used to analyze the results of this study?
Question 14.45
College students, anxiety, depression, and a MANOVA: Jason Nelson and Noel Gregg (2012) conducted a study of college students with disabilities. They reported that: “A 3 × 3 × 2 MANOVA was conducted to determine the effect of level of educational attainment (transitioning adolescents and college underclassmen—
What are the independent variables in this study and what are their levels?
What are the dependent variables in this study?
Based on these variables, explain why the researchers conducted a MANOVA.
The researchers report that there was only one significant effect in this MANOVA. Specifically, “Tukey’s HSD post hoc tests indicated college underclassmen with disabilities had higher BAI (M = 9.10, SD = 8.37) and BDI-
II scores (M = 9.30, SD = 8.92) than did transitioning adolescents with disabilities (BAI: M = 5.18, SD = 6.18; BDI- II: M = 4.50, SD = 5.40). The effect sizes for these group differences on the BAI (d = .50) and BDI- II (d = .59) were medium in magnitude.” - Put these findings into plain English and in your own words.
- Explain why the researchers conducted a Tukey HSD test.
- Why did the researchers report Cohen’s d when they conducted a form of ANOVA (i.e., MANOVA)? (Hint: Think about the number of means in their comparisons.)
Putting It All Together
Question 14.46
Skepticism, self-
389
State the independent variables and their levels. State the dependent variable.
What kind of ANOVA would be used to analyze these data? State the name using the original language as well as the more specific language.
Use the more specific language of ANOVA to calculate the number of cells in this research design.
Draw a table of cell means, marginal means, and the grand mean. Assume that equal numbers of participants were assigned to each cell (even though this was not the case in the actual study).
Describe the significant main effect in your own words.
Draw a bar graph that depicts the main effect.
Why is the main effect misleading by itself?
Is the main effect qualified by a statistically significant interaction? Explain. Describe the interaction in your own words.
Draw a bar graph that depicts the interaction. Include lines that connect the tops of the bars and show the pattern of the interaction.
Is this a quantitative or qualitative interaction? Explain.
Change the cell mean for the participants who had a healthy test outcome and completed the dependent measure before the TAA test so that this is now a qualitative interaction.
Draw a bar graph depicting the pattern that includes the new cell mean.
Change the cell mean for the participants who had a healthy test outcome and completed the dependent measure before the TAA test so that there is now no interaction.
Draw a bar graph that depicts the pattern that includes the new cell mean.
Question 14.47
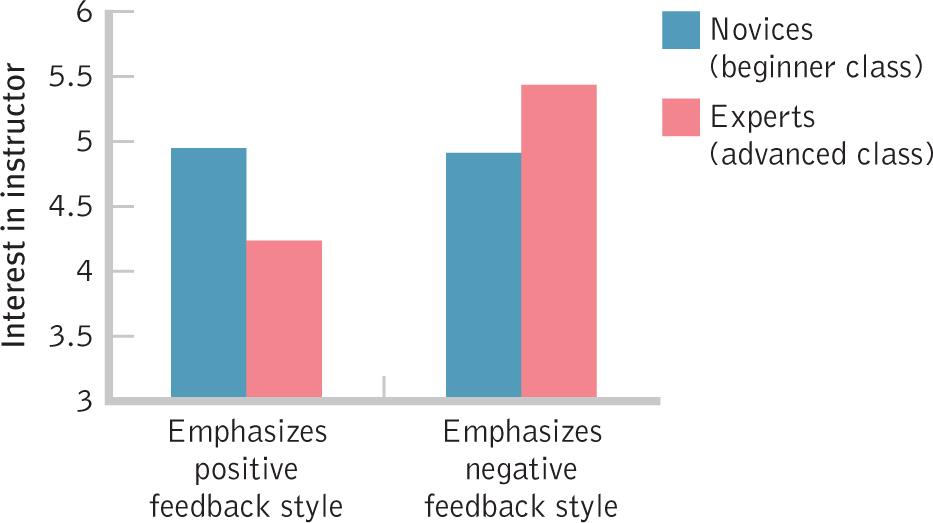
Feedback and ANOVA: Stacey Finkelstein and Ayelet Fishbach (2012) examined the impact of feedback in the learning process. The following is an excerpt from their abstract: “This article explores what feedback people seek and respond to. We predict and find a shift from positive to negative feedback as people gain expertise. We document this shift in a variety of domains, including feedback on language acquisition, pursuit of environmental causes, and use of consumer products. Across these domains, novices sought and responded to positive feedback, and experts sought and responded to negative feedback” (p. 22).
Based on the abstract, what are the independent variables and what are their levels?
What are possible dependent variables, based on the description in the abstract?
The researchers conducted several experiments, one of which examined students in beginning and advanced French classes. Here is the result of one analysis: “The analysis also yielded the predicted expertise X feedback interaction (F(1,79) = 7.31, p < .01). Is this interaction statistically significant? Explain your answer.
What important statistic is missing from their report? Why would it be helpful to include this statistic?
The results in part (c) are represented by the graph here. We would, of course, have to conduct additional analyses to know exactly which bars are significantly different from each other. That said, what does the overall pattern seem to indicate for this analysis?
How would you redesign this graph in line with what you learned in Chapter 3? Give at least two specific suggestions.
390