1.4 Introduction to Hypothesis Testing
Hypothesis testing is the process of drawing conclusions about whether a particular relation between variables is supported by the evidence.
When John Snow suggested that the pump handle be removed from the Broad Street well, he was testing his idea that an independent variable (contaminated well water) led to a dependent variable (deaths from cholera). Behavioral scientists use research to test ideas through a specific statistics-
Determining what breed of dog you most resemble might seem silly; however, adopting a dog is a very important decision. Can an online quiz such as the Animal Planet “Dog Breed Selector” help (http:/
10
An operational definition specifies the operations or procedures used to measure or manipulate a variable.
An operational definition specifies the operations or procedures used to measure or manipulate a variable. We could operationalize a good outcome with a new dog in several ways. Did you keep the dog for more than a year? On a rating scale of satisfaction with your pet, did you get a high score? Does a veterinarian give a high rating to your dog’s health?
Do you think a quiz would lead you to make a better choice in dogs? You might hypothesize that the quiz would lead to better choices because it makes you think about important factors in dog ownership, such as outdoor space, leisure time, and your tolerance for dog hair. You already carry many hypotheses like these in your head. You just haven’t bothered to test most of them yet, at least not formally. For example, perhaps you believe that North Americans use banking machines (ATMs) faster than Europeans do, or that smokers simply lack the willpower to stop. Maybe you are convinced that the parking problem on your campus is part of a conspiracy by administrators to make your life more difficult.
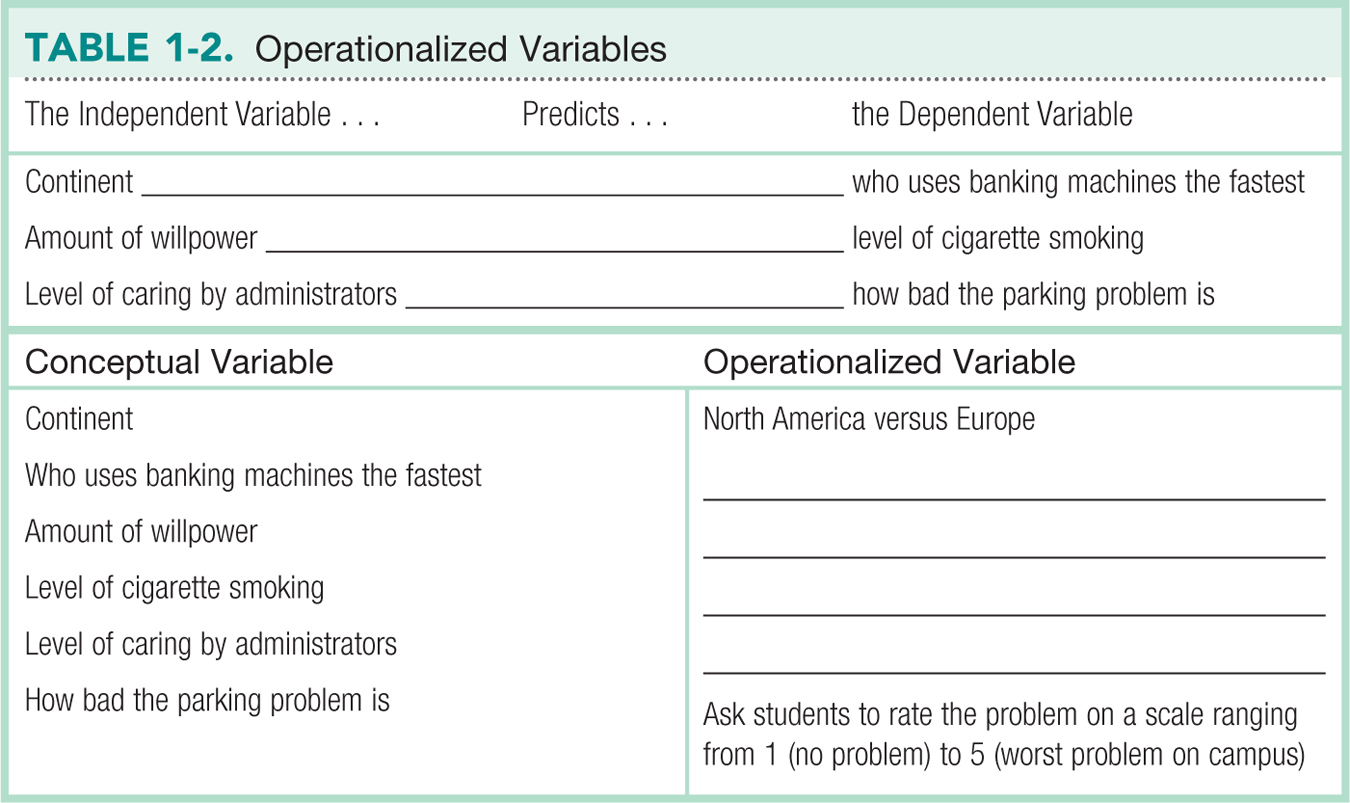
In each of these cases, as shown in the accompanying table, we frame a hypothesis in terms of an independent variable and a dependent variable. The best way to learn about operationalizing a variable is to experience it for yourself. So propose a way to measure each of the variables identified in Table 1-2. We’ve given you a start with “continent”—North America versus Europe (easy to operationalize)—and how bad the parking problem is (more difficult to operationalize).

Conducting Experiments to Control for Confounding Variables
A correlation is an association between two or more variables.
Once we have decided how to operationalize the variables, we can conduct a study and collect data. There are several ways to approach research, including experiments and correlational research. A correlation is an association between two or more variables. In Snow’s cholera research, it was the idea of a systematic co-
11
In random assignment every participant in a study has an equal chance of being assigned to any of the groups, or experimental conditions, in the study.
An experiment is a study in which participants are randomly assigned to a condition or level of one or more independent variables.
The hallmark of experimental research is random assignment. With random assignment, every participant in the study has an equal chance of being assigned to any of the groups, or experimental conditions, in the study. And an experiment is a study in which participants are randomly assigned to a condition or level of one or more independent variables. Random assignment means that neither the participants nor the researchers get to choose the condition. Experiments are the gold standard of hypothesis testing because they are the best way to control confounding variables. Controlling confounding variables allows researchers to infer a cause–
Experiments achieve equality between groups by randomly assigning participants to different levels, or conditions, of the independent variable. Random assignment controls the effects of personality traits, life experiences, personal biases, and other potential confounds by distributing them across each condition of the experiment to an equivalent degree.
EXAMPLE 1.1
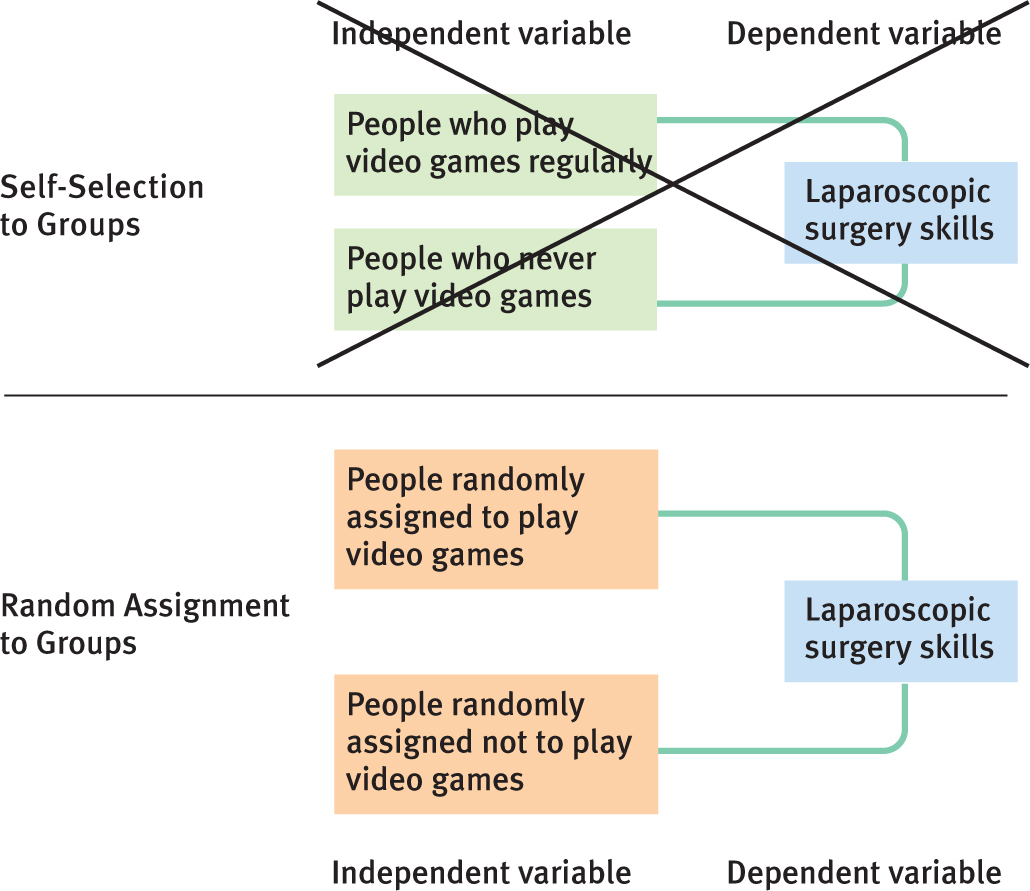
It is difficult to control confounding variables, so let’s see how random assignment helps to do that. You might wonder whether the hours you spend playing Angry Birds or Call of Duty are useful. A team of physicians and a psychologist investigated whether video game playing (the independent variable) leads to superior surgical skills (the dependent variable). They reported that surgeons with more video game playing experience were faster and more accurate, on average, when conducting training drills that mimic laparoscopic surgery (a surgical technique that uses a small incision, a small video camera, and a video monitor) than surgeons with no video game playing experience (Rosser et al., 2007).
In the video game and surgery study, the researchers did not randomly assign surgeons to play video games or not. Rather, they asked surgeons to report their video game playing histories and then measured their laparoscopic surgical skills. Can you spot the confounding variable? People may choose to play video games because they already have the fine motor skills and eye–
MASTERING THE CONCEPT
1.5: When possible, researchers prefer to use an experiment rather than a correlational study. Experiments use random assignment, which is the only way to determine whether one variable causes another.
It would be much more useful to set up an experiment that randomly assigns surgeons to one of the two levels of the independent variable: (1) play video games or (2) do not play video games. Random assignment assures us that our two groups are roughly equal, on average, on all the variables that might contribute to excellent surgical skills, such as fine motor skills, eye–
12

Figure 1-
Indeed, many researchers have used experimental designs to explore the causal effects of video game playing. They have found both positive effects, such as improved spatial skills following action games (Feng, Spence, & Pratt, 2007), and negative effects, such as increased hostility after playing violent games with lots of blood (Bartlett, Harris, & Bruey, 2008).
Between-Groups Design versus Within-Groups Design
Experimenters can create meaningful comparison groups in several ways. However, most studies have either a between-
In a between-
A between-
In a within-
A within-
Many applied questions in the behavioral sciences are best studied using a within-
13

Figure 1-
Correlational Research
Often, we cannot conduct an experiment because it is unethical or impractical to randomly assign participants to conditions. Snow’s cholera research, for example, did not use random assignment; he could not randomly assign some people to drink water from the Broad Street well. His research design was correlational, not experimental.
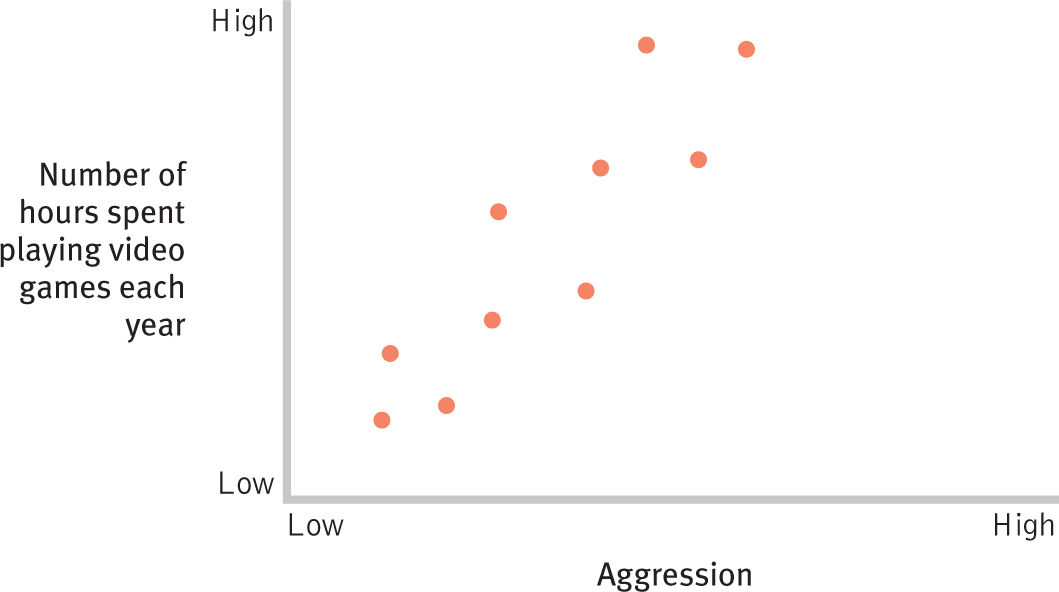
In correlational studies, we do not manipulate either variable. We merely assess the two variables as they exist. For example, it would be difficult to randomly assign people to either play or not play video games over several years. However, we could observe people over time to see the effects of their actual video game usage. Möller and Krahé (2009) studied German teenagers over a period of 30 months and found that the amount of video game playing when the study started was related to aggression 30 months later. Although these researchers found that video game playing and aggression are related, they do not have evidence that playing video games causes aggression (as shown in Figure 1-3). As we will discuss in Chapter 13, there are always alternative explanations in a correlational study; don’t be too eager to infer causality just because two variables are correlated.
Next Steps
Outlier Analysis
An outlier is an extreme score that is either very high or very low in comparison with the rest of the scores in the sample.
John Snow wanted to understand the cholera outbreak, in part to prevent another one. So he paid particular attention to outliers, cases that did not fit the pattern that he had observed. An outlier is an extreme score that is either very high or very low in comparison with the rest of the scores in the sample. Some researchers conduct outlier analysis, studies examining observations that do not fit the overall pattern of the data, in an effort to understand the factors that influence the dependent variable.
In outlier analysis, studies examine observations that do not fit the overall pattern of the data in an effort to understand the factors that influence the dependent variable.
Snow used outlier analysis when he sought to explain why two Londoners died in the cholera epidemic even though they lived far away from the Broad Street well that transmitted that terrible disease. A woman in West End, Hampstead, died on September 2, 1854; her niece in Islington died the following day. These two women had very high scores on the variable “distance from the Broad Street well,” unexpected among those who died of cholera.
These two cases did not fit the overall pattern, so Snow saddled up his horse and rode up to Hampstead to interview relatives of the two women who should not have died of cholera. His interview revealed that the Hampstead woman had once lived near Broad Street and developed a taste for the wonderful-
14
The outliers on Snow’s map allowed him to see other clues about the cholera outbreak, including what may be the only known case in which lives were saved by drinking large amounts of beer. The 535 inmates at the workhouse had their own well; the 70 unaffected men working at the nearby Broad Street brewery were given a free daily allowance of beer; the 18 deaths at a nearby factory occurred because two large tubs of Broad Street well water were always kept available for the thirsty workers.
Outlier analysis would prove to be crucial once again in the 1990s, when researchers were desperately trying to track down effective strategies to fight the ongoing HIV/AIDS epidemic (Kolata, 2001). In this case, the outlier was a hemophiliac, Robert Massie, who “should” have died but did not (Belluck, 2005). Like many other hemophiliacs, Massie had become infected through repeated exposure to the untested, contaminated blood supply. Oddly, though, Massie didn’t show any symptoms of AIDS! His immune system was working so well that it convinced researchers that the immune system could fight off the AIDS virus. Identifying him as an outlier in part led the way to effective, innovative treatments for HIV. Researchers can stumble into critical insights by paying attention to statistical outliers.
CHECK YOUR LEARNING
Reviewing the Concepts
- Hypothesis testing is the process of drawing conclusions about whether a particular relation between variables (the hypothesis) is supported by the evidence.
- All variables must be operationalized—
that is, we need to specify how they are to be measured or manipulated. - Experiments attempt to explain a cause–
effect relation between an independent variable and a dependent variable. - Random assignment to groups to control for confounding variables is the hallmark of an experiment.
- Most studies have either a between-
groups design or a within- groups design. - Correlational studies can be used when it is not possible to conduct an experiment.
- Outliers are extreme scores that are very different from the rest of the observations.
- Outlier analysis refers to studies that examine outliers, those scores that do not fit the overall pattern of the rest of the data.
Clarifying the Concepts
- 1-
10 How do the two types of research discussed in this chapter—experimental and correlational— differ? - 1-
11 How does random assignment help to address confounding variables?
Calculating the Statistics
- 1-
12 College admissions offices use several methods, including SAT scores, to operationalize the academic performance of high school students applying to college. Can you think of other ways to operationalize this variable?
15
Applying the Concepts
- 1-
13 Expectations matter. Researchers examined how expectations based on stereotypes influence women’s math performance (Spencer, Steele, & Quinn, 1999). Some women were told that a gender difference was found on a certain math test and that women tended to receive lower scores than men did. Other women were told that no gender differences were evident on the test. Women in the first group performed more poorly than men did, on average, whereas women in the second group did not.- Briefly outline how researchers could conduct this research as a true experiment using a between-
groups design. - Why would researchers want to use random assignment?
- If researchers did not use random assignment but rather chose people who were already in those conditions (i.e., who already either believed or did not believe the stereotypes), what might be the possible confounds? Name at least two.
- How is math performance operationalized here?
- Briefly outline how researchers could conduct this study using a within-
groups design.
- Briefly outline how researchers could conduct this research as a true experiment using a between-
Solutions to these Check Your Learning questions can be found in Appendix D.