Chapter 2 SPSS®
The left-hand column in “Data View” is prenumbered, beginning with 1. Each column to the right of that number contains information about a particular variable; each row represents a unique individual. Notice the choices at the top of the “Data View” screen. Enter the pacing index data from page 29, then, from the menu, select Analyze → Descriptive Statistics → Frequencies. Select the variables you want SPSS to describe by highlighting them and clicking the arrow in the middle.
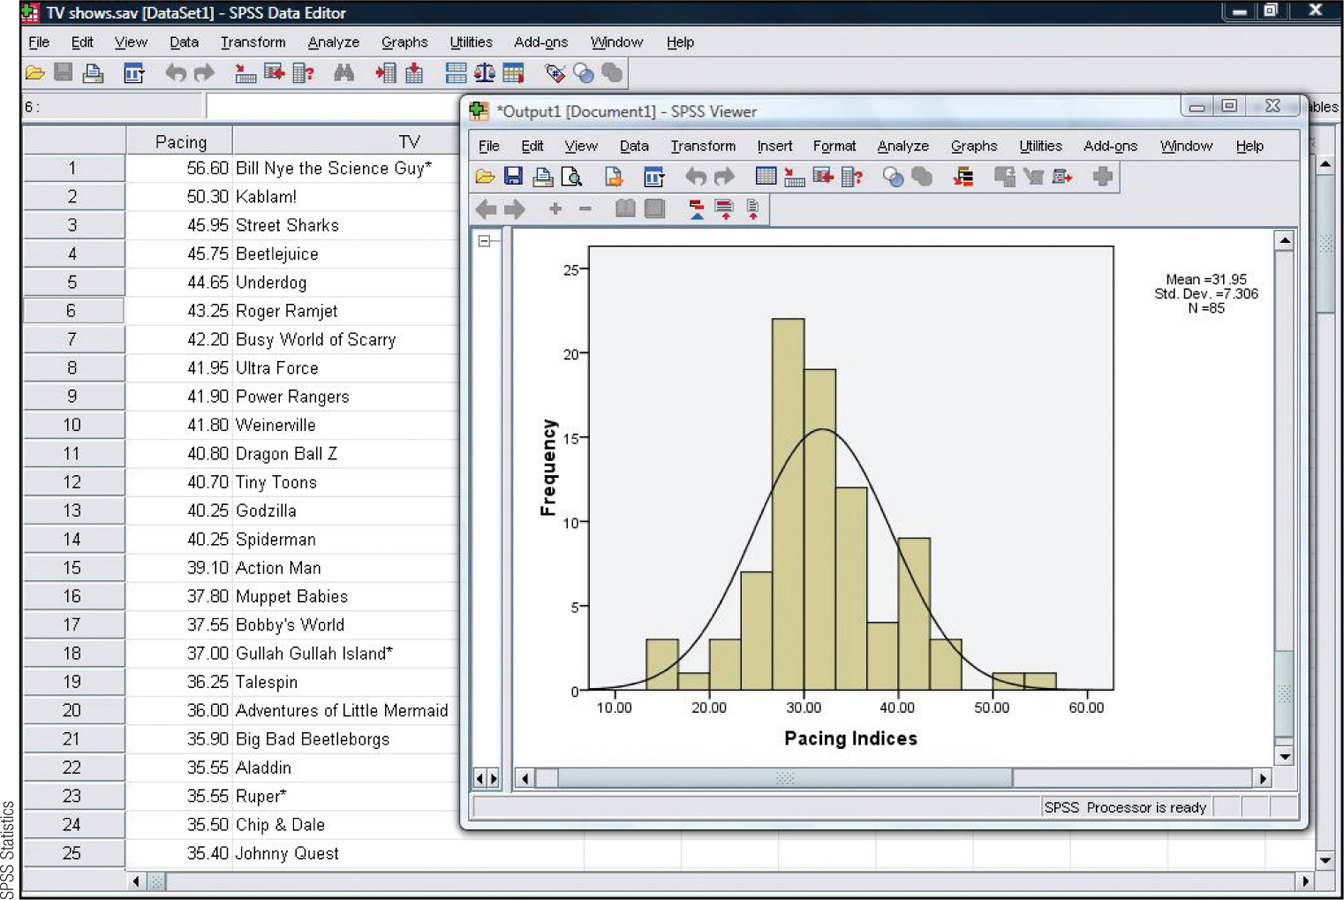
We also want to visualize each variable, so after selecting “Frequencies,” select Charts → Histograms (click the box next to “with normal curve”) → Continue → OK.
For all of the SPSS functions, an output screen automatically appears after “OK” is clicked. The screenshot shown here depicts the part of the SPSS output that includes the histogram. Double-click on the graph to enter the SPSS Chart Editor, and then double-click on each feature in order to make the graph look like we want it to. For example, you might choose to click on the word “Frequency,” that by default appears vertically and in sideways lettering along the y-axis. You would then choose “Text Layout” and click on the circle next to “Horizontal” under “Orientation,” so that after you click “Apply,” you can read the word “Frequency” without having to twist your head. Click and change any feature of the graph that lets the data speak more clearly.