Chapter 4 SPSS®
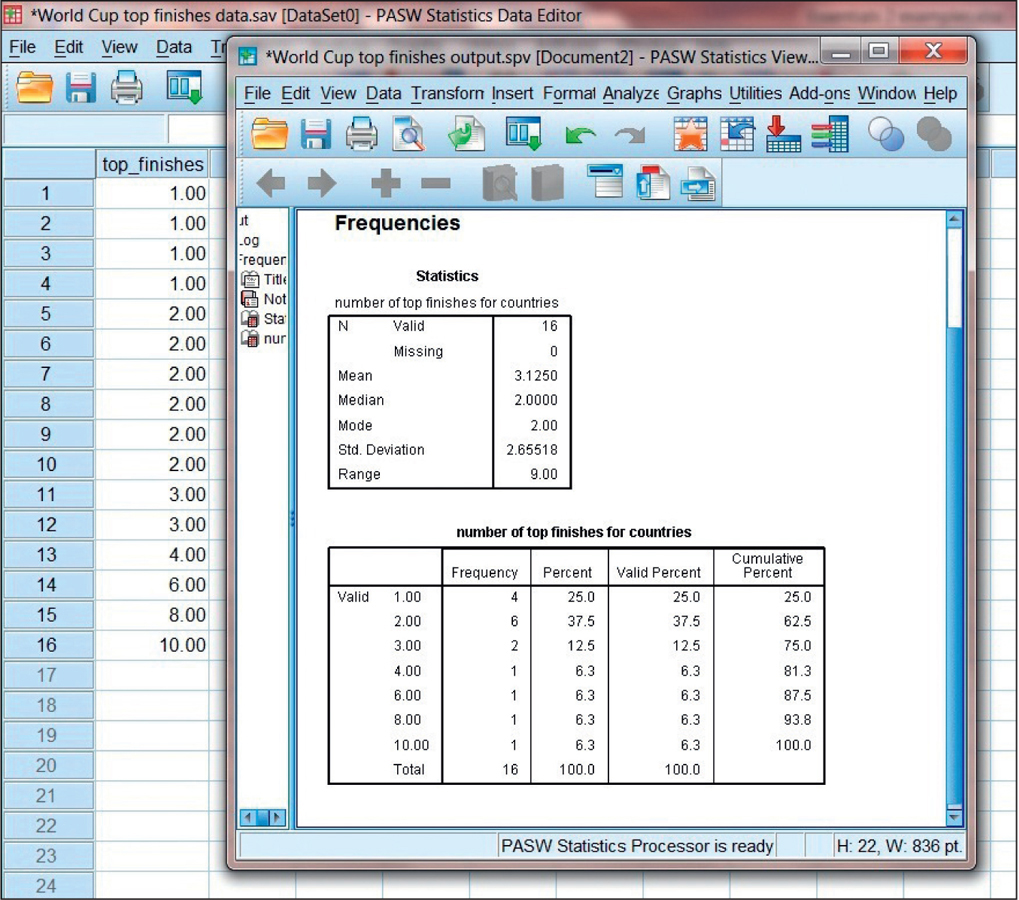
The left-hand column in “Data View” is prenumbered, beginning with 1. Each column to the right of that number contains information about a particular variable; each row across from that number represents a unique individual. Notice the choices at the top of the “Data View” screen. Enter the data for countries’ top finishes in the World Cup, omitting countries with a score of 0: 1, 1, 1, 1, 2, 2, 2, 2, 2, 2, 3, 3, 4, 6, 8, and 10, as shown on the left of the screenshot below.
To get a numerical description of a variable, select: Analyze → Descriptive Statistics → Frequencies. Then select the variable of interest, “top finishes,” by highlighting it and then clicking the arrow to move it from the left side to the right side. Then select: Statistics → Mean, Median, Mode, Std. deviation, Range → Continue → OK.
Your data and output will look like those in the screenshot shown here.