Chapter 6 SPSS®
SPSS lets us understand each variable, identify its skewness, and explore how well it fits with a normal distribution. Enter the 140 heights from Table 6-1.
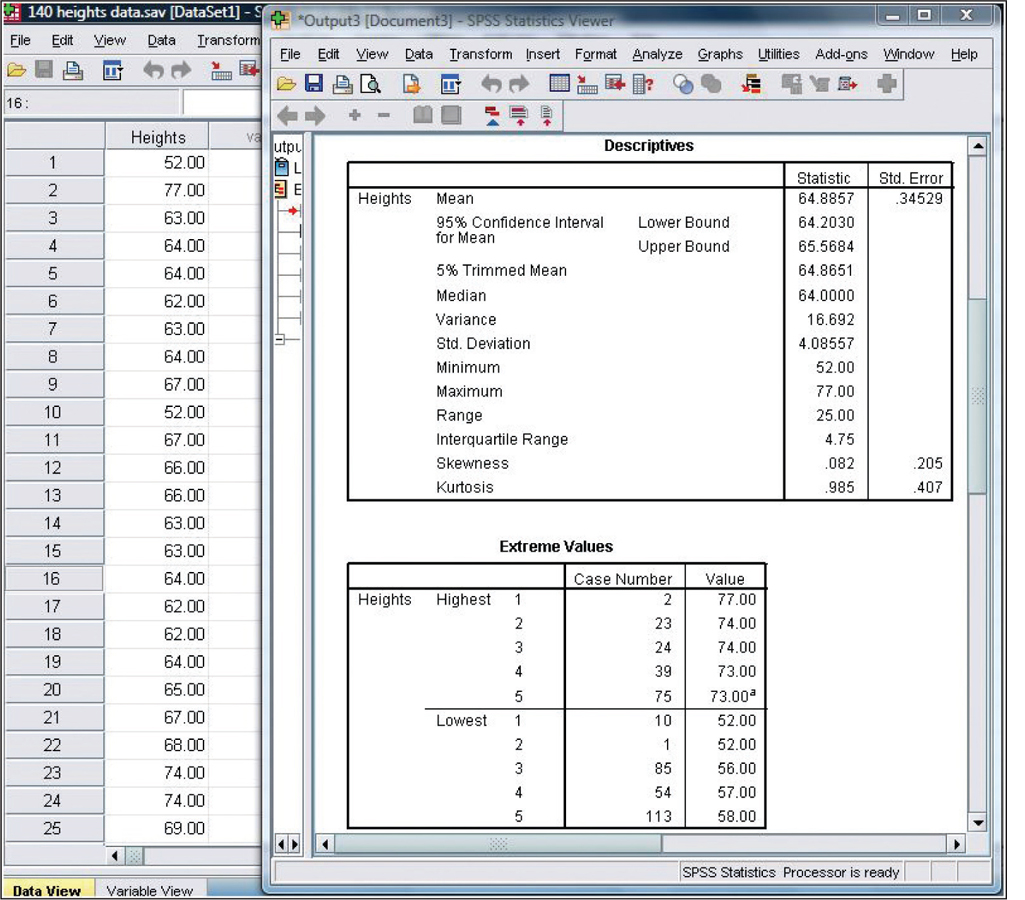
We can identify outliers that might skew the normal curve by selecting Analyze → Descriptive Statistics → Explore → Statistics → Outliers. Click “Continue.” Choose the variable of interest, “Heights,” by clicking it on the left and then using the arrow to move it to the right. Click “OK.” The screenshot shown here depicts part of the output.
We encourage you to play with data and explore the many features in SPSS, especially when it is your own data. SPSS is much easier to learn when you know why every number was included in the study in the first place. It’s also much more interesting to test your own ideas!

153