Chapter 9 SPSS®
Let’s conduct a single-sample t test using the data on number of counseling sessions attended that we tested earlier in this chapter. The five scores were: 6, 6, 12, 7, and 8.
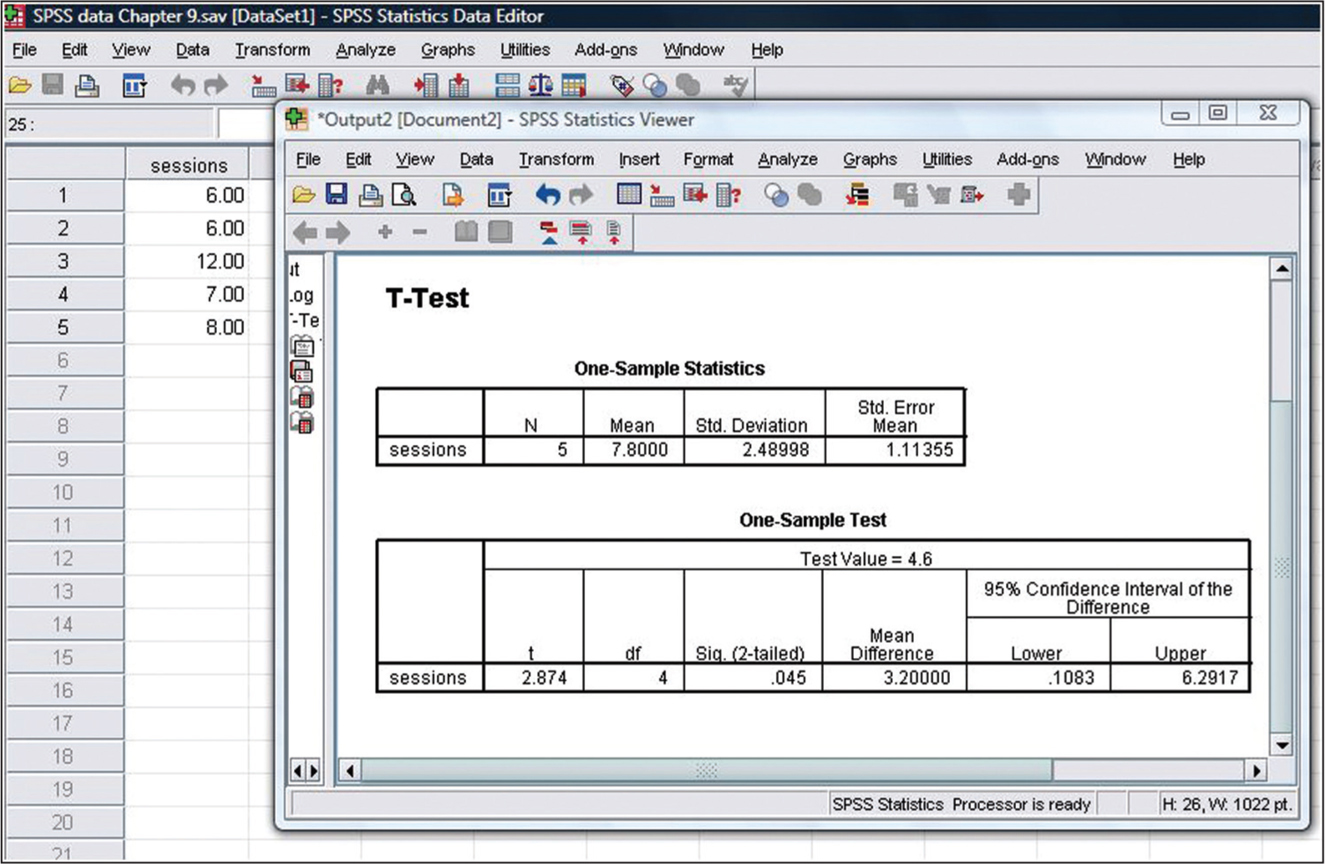
Select Analyze → Compare Means → One-Sample T Test. Highlight the dependent variable (sessions) and click the arrow in the center to choose it. Type the population mean to which we’re comparing the sample, 4.6, next to “Test Value,” and click “OK.” If you conduct this test using SPSS, you’ll notice that the t statistic, 2.874, is almost identical to the one we calculated, 2.873. The difference is due solely to the rounding decisions. You’ll also notice that the confidence interval is different from the one we calculated. This is an interval around the difference between the two means, rather than around the mean of the sample. The p value is under “Sig (2-tailed).” The p value of .045 is less than the chosen p level of .05, an indication that this is a statistically significant finding.