Chapter 7. Lab 7 Laboratory Skills IV: Tool Use
Learning Goals
- Learn how to use biological equipment to successfully complete BIO 204/205 and upper division biology labs
- Learn a method for learning new instruments safely and effectively
- Experiment with living organisms using actual lab equipment to develop your understanding of data collection, data analysis, and data presentation
Lab Outline
Pre-Lab Activity: Orientation to Laboratory Equipment in the Biology Learning Center
Activity 1: Bivalve Feeding Experiments
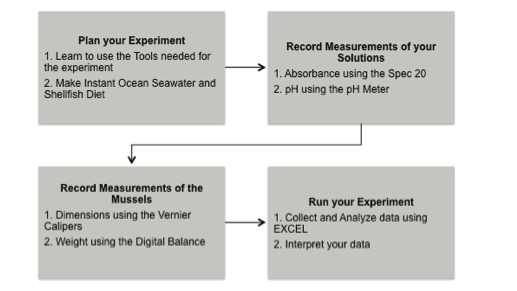
1A: Plan your Experiment
1B: Make Solutions and Measurements
1C: Set up and Run your Experiment
7.1 Scientific Inquiry

In the coastal marine estuarine environment, like the one just north of the Stony Brook campus, bivalves are important filter feeders on seston, the particulate matter suspended in the water. Mytilus edulis, the blue mussel, feeds on seston where the ratio of food to inorganic silt particles is highly variable depending on the season, weather, wave action and filter feeder abundance. Bivalve feeding is of great interest to marine biologists since marine aquaculture of shellfish is a large and important industry in coastal areas, and filter feeding animals are important to the foodweb and help keep marine waters clean.
Do bivalves filter feed at a constant rate all year like machines, or do they change their feeding behavior depending on the season and food sources? Can they tell the difference between high vs. low food quality seston? If they are given more food can they digest it more quickly and grow faster? We know that mussels make pseudofeces, they literally separate food particles from inorganic silt particles and expel the waste without sending much of it through their digestive tract. But there is quite a bit we still are learning about feeding, growth and development in bivalves.
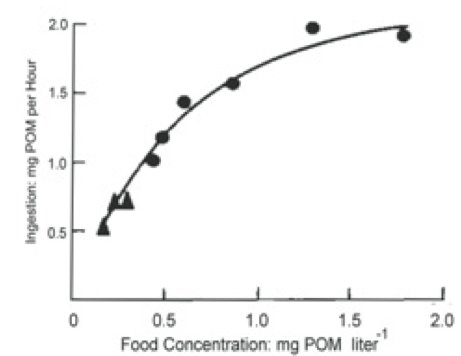
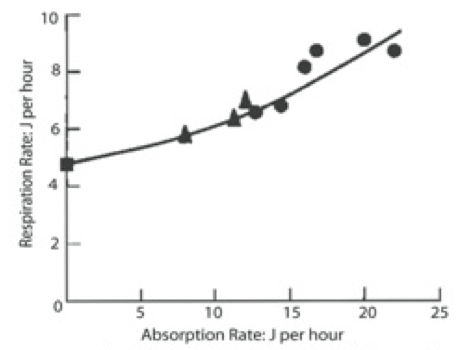
Bayne et al. (1989) studied the impact of different seston concentrations containing variable amounts of organic matter on the feeding, digestion, and scope for growth of mussels. The results from two of their experiments are displayed in Figures 1 and 2. In the first graph Figure 1, the data show that mussels ingest food, known as particulate organic matter (POM) at a higher rate as food concentration increases. Figure 2 shows an increase in respiration rate as food absorption increases. This indicates a metabolic cost in terms of making digestive enzymes and peristalsis in the gut.
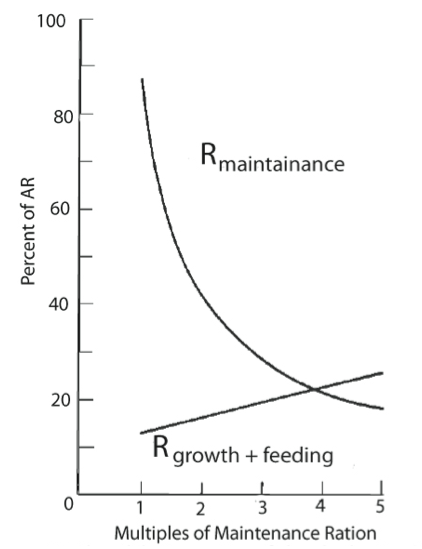
Their experiments showed an increase in growth of mussels when ingestion exceeds maintenance food levels (Fig 3). When mussels are fed below maintenance levels the metabolic cost associated with simply staying alive and feeding was higher than food intake and there is no additional energy left to enable growth.
Bayne et al. used specialized instruments in their feeding experiments to make different concentrations of seston, to count particulate matter such as cells and detritus and to measure dissolved oxygen. Their methods also required circulating seawater tanks for sustaining the blue mussels.
The laboratory tools used in today’s lab share many functional similarities with the tools used in sophisticated research laboratories. In BIO 204 we use spectrophotometers for estimating cell numbers and concentrations of soluble colored reagents; balances for weighing reagents; graduated cylinders and pipettors for making solutions; meters such as pH meters for measuring specific chemical components, calipers and rulers for measuring length; and centrifuges for concentrating suspended components of different densities in solutions. You must “learn how to learn” new tools in this lab but you will also learn how to begin to implement these tools to investigate a scientific question.
20.08 J per ml oxygen. (Gnaiger, 1983)
7.2 Background
Most modern instrumentation is based on some simple engineering theme, like measurements of weight or light levels, and new instruments are often simply improvements on existing equipment—but the new scientific designs and technologies used in making these improvements will require you to learn new concepts and procedures. Almost as soon as one kind of technology comes into common use another is introduced. You can be quite certain that you will be a “beginner” in the use of new instruments throughout your professional career and private life. Since new techniques and instrumentation occur so regularly in modern research laboratories, in many ways it is more important for your professional training as a student to “learn how to learn” new instrumentation than it is to learn to use any one instrument since the one you learn today may be obsolete tomorrow.
A Word of Encouragement: Curiosity
A Word of Caution: Sharp
A Word to the Wise: Learn How to Learn
from the “The Complete Japanese Joinery-A Handbook of Japanese Tools and Techniques”
Today’s laboratory focuses on a general strategy one can apply to the use of almost any new or unfamiliar piece of equipment. If you learn to apply this strategy consistently, you will quickly gain confidence in your ability to learn new laboratory equipment in record time. Since you are taking BIO 204 there is a good chance you will have an opportunity to work in a research lab before you graduate from Stony Brook University. There are some professional behaviors you should develop while taking this course—among the most important is to develop your curiosity and your interest in detail. When it comes to the lab equipment you actually have to use, these behaviors are critical to your success.
There are many experiments in biology and medicine where weight, volume, linear measurements, cell density and colorimetric measurements are important. Digital balances are ubiquitous tools for measuring weight. Vernier calipers are widely used to take linear measurements of length, depth and inside diameters of objects. Micropipettors and spectrophotometers are true workhorses of many research labs. They are indispensible for measuring small volumes of solutions. Spectrophotometers are good at detecting differences in light transmission, or light absorbance of cloudy solutions or test solutions in which there may be color changes.
You must learn to use these instruments to obtain the most accurate and precise measurements possible before beginning your experiment with living organisms. Be meticulous about following the directions for the use of each instrument. Be aware of the metric units used in these measurements and the scale of the measurements. For example, are you weighing samples in kilograms, grams or milligrams; are you measuring length in meters, centimeters, or millimeters? Do you know the number of significant digits that can be used for your measurements?
7.3 Resources
Lab Manual Appendices – SALI; compound microscope, dissecting scope, balances, pipettes, graduated cylinders, spectrophotometer, pH meter, Vernier calipers, and centrifuge; and making chemical solutions.
Adams D. Math for Life. Bioportal for Sadava et al. Life 9th Edition. New York: Sinauer. 182 p.
Barker K. At the Bench: A Laboratory Navigator (Updated Edition). Cold Spring Harbor: Cold Spring Harbor Laboratory Press. 2005. 465 p.
Bayne BL, Hawkins AJS, Navarro E, Iglesias IP. Effects of seston concentration on feeding, digestion and growth in the mussel Mytilus edulis. Mar. Ecol. Prog. Ser. 1989; 55: 47-54.
Gnaiger E. Calculation of energetic and biochemical equivalents of respiratory oxygen consumption. In: Gnaiger E and Forstner H, editors. Polarographic oxygen sensors. Berlin: Springer-Verlag. 1983. pp. 337-345.
Harris M, Taylor G, Taylor J. Math and Statistics for the Life Sciences. New York: W. H. Freeman. 2008. 187 p.
Sato H and Nakahara Y. The Complete Japanese Joinery: A Handbook of Japanese Tools and Techniques. Hartley and Marks Publishers Inc. 1995. pp. 389.
7.4 Lab Preparation

Watch the vodcast and read this lab. Write all notes in your lab notebook. There will be a Lab Quiz on this information.
7.5 Activity 1: Bivalve Feeding Experiments
Learning Objectives
After successful completion of this activity, you should be able to:
- Properly use one or more of the following tools: Vernier caliper, micropipettors, digital balance, graduated cylinder, spectrophotometer, and pH meter (LO15)
- Apply a SALI to a new and unfamiliar piece of lab equipment (LO16)
Materials
Instant Ocean®
Reed Mariculture Shellfish Diet 1800® (30% Isochrysis, 30% Thalassiosira weissflogii (TW), 20% Pavlova, and 20% Tetraselmis)
Culture dishes
Beakers
Transfer pipettes
Test tubes
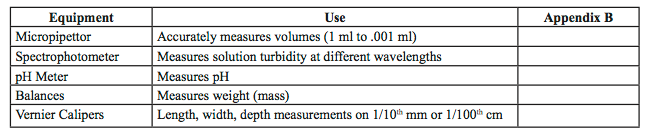
Detailed instructions in the use of the tools are written in Appendix B of this manual, and the podcast about these lab tools was posted on-line as part of your pre-lab and in the Biology Learning Center. Fill in the page number in the table below.
What is our test organism?
We will use a common resident of Stony Brook Harbor, the blue mussel Mytilus edulis as our test organism and we will make our own food using a mixture of algal cells known as shellfish diet. We will control the amount of food in our experiments using measured proportions of shellfish diet in salt water solutions. If undisturbed, mussels placed in containers containing food and sea water will feed and the water made cloudy by the algal suspension will gradually clear. Food will be ingested by the mussel and any suspended particles rejected as “not food” will be released by the mussel as string-like pseudofeces. Pseudofeces do not pass through the animal’s gut—particles are sorted as food or non-food on the ctenidia (gills). Food is transported to the mouth and non-food is transported to the dorsal-posterior end of the mussel and usually is ejected through the incurrent siphon.
What can we measure?
We can use two ways of measuring feeding rate by mussels, one by rate of sea water clearing by the feeding mussels, and the other using the length of pseudofeces released by the mussel. We will measure water clarity using an instrument called a spectrophotometer that measures the turbidity (cloudiness) of water—when shellfish diet is first added the water will be cloudy and the spectrophotometer readings will show that relatively little light will pass through the suspension. As the mussels feed and the water clears, the spec readings will show a greater amount of light passing through the solution. Pseudofeces lengths can be estimated using a ruler.
How will you design your experiment and set up the proper controls?
You probably have questions about how to use mussels in experiments. How will you vary the quality of the food source you are using? How will you control the amount of food given to the mussels and how will you measure the ingestion rate? How will you know that the shellfish are clearing the water and there isn’t some other factor causing the water to clear? You can plan the amount of food you give the animals and carefully time the clearing rate of the water the mussels are in. But to determine whether something other than the mussels is causing the water to clear, you need a control. The control condition leaves out the factor that you are experimenting with, the mussels. If you mix shellfish diet with seawater that does not contain mussels and the water still clears, some other factor is affecting your measurements and you have to question your results.
Plan your experiment and the tools you’ll need before you add organisms to your set up. Minimize handling of living organisms as much as possible.
7.6 Activity 1A: Plan your Experiment
You will use live mussels, their food, and sea water solutions in an experiment of your own design using the materials on hand in lab. Feel free to come up with your own experimental design within the limits of supplies in lab. For example you might wonder if you doubled or halved the: amount of food; number of mussels; total weight of the mussels in a culture dish, will the animals feed faster or slower than another dish with more or less food or mussels? Does the saltiness of the water matter? The experiment is yours to design but remember to think about the following considerations and answer them in your Lab Notebook:
- How long do you have to run your experiment?
- Will you vary the quality of the food you will feed the mussels? If so how will you vary the quality of the food source you are using?
- How will you make seawater solutions?
- How will you know that the shellfish are clearing the water and there isn’t some other factor causing the water to clear?
- Should you measure the size of the mussels? If so, how will you do it?
- What observations will you make? How often will you make observations?
- What should your data table look like?
7.7 Procedure
- Write out a brief protocol of the steps you will follow and sketch a diagram of your experimental set up in your lab notebook. Throughout the experiment, note anything you discover about tool use in this experimental setting.
- Determine the amount of additional Instant Ocean and shellfish diet that you will need for your experiment and prepare these as stock (concentrated) solutions. Further directions below.
- Label your 4 culture dishes and add the appropriate ingredients to each, excluding the mussels. Note that each culture dish requires 250 ml of Instant Ocean seawater.
- Take your initial readings in the spectrophotometer once your setup is ready. Monitor the changes in the suspended food density using the spectrophotometer.
7.8 Activity 1B: Prepare Solutions and Take Measurements Using Biological Equipment
Your mussels will be feeding in seawater. You will make your own seawater with commercial sea salts called Instant Ocean® and make dilutions of Shellfish Diet ® from a stock (concentrated) solution. Making chemical solutions are an extremely common and important part of many biological experiments. The tools used in making solutions include the balance for weight reagents, graduated cylinders for measuring large volumes of fluids, and micropipettors for measuring small volumes of fluids. Use the Tool descriptions in Appendix B for detailed instructions.
In this activity, you will use the following tools:
- Micropipettors to measure particular ranges of small volumes.
- Digital balances to measure Instant Ocean salts and the weight of the mussels.
- Graduated Cylinders to measure relatively large volumes of fluids usually greater than 5 ml. They are not as precise or accurate as micropipettes.
- Spectrophotometers to measure fluid turbidity. Fluids that contain particulates such as cells, or colored reagents such as dyes can be quantified using spectrophotometer readings.
- pH meters to measure solution acidity/alkalinity, or hydrogen ion concentration relative to known standard solutions.
- Vernier caliper to measure the length, width, and depth of the mussels in your experiment.
7.9 Procedure
Prepare Instant Ocean (Steps 1-4)
Sea water is water with various salts in it. You can make your own sea water using fresh water and a product called Instant Ocean that has the same proportion of different salts as most sea water. The mussels collected from Stony Brook Harbor are acclimated to sea water that is about 28 parts per thousand sea salt or 28 ppt. This means that you can make a liter of sea water by taking 28 grams of Instant Ocean and adding freshwater to a total volume of 1 liter.
- Make a liter of 28 ppt sea water by weighing the appropriate amount of Instant Ocean and adding deionized water to the appropriate volume.
- Mix the contents thoroughly until all the salts have dissolved.
- Remove a 3 ml aliquot of the seawater and record the absorbance of the sea water at a wavelength of 600 nm in the Spec 20. What is the proper blank?
- Pour the aliquot back into your stock and keep your Instant Ocean for use in your experiment.
What does your absorbance reading tell you about the spectrophotometric properties of Instant Ocean?
Produce serial dilutions of Shellfish Diet (Steps 5-9)
Solutions in research labs are made in many different ways, but there are standard concentrations commonly used in labs: moles, percent, parts per thousand, parts per million, etc. Review Appendix C for examples. Also, it is common to use concentrated stocks and dilute them to obtain a desired concentration and volume. The easiest way to make a broad range of dilutions is to use the method called “serial dilutions.”
- Review Box 1 on serial dilutions. Make 10 ml of a 1:100 dilution of the concentrated lab stock shellfish diet solution using your Instant Ocean.
- Record how you made your solutions along with the instruments that you used. Store your diluted shellfish diet in a labeled bottle.
- Blank the Spec 20 with the appropriate solution. Remove a sample of the shell fish diet into a glass tube and read its absorbance at 600 nm. What did you use to blank the Spec 20?
- What does your absorbance tell you about the concentration of shell fish diet? What would you expect to happen to the absorbance of solutions that are 10 fold more dilute than the ones you prepared?
- Return the samples used to measure absorbance to the bottle and keep it for your experiment.
Box 1 Making Serial Dilutions
Making serial dilutions of concentrated solutions is a standard procedure in biology and chemistry. The 1 to 10 ratios allow us to quickly reduce concentrations of solutions from 1:1 to 1:10, even to 1:1,000,000 in a few brief steps.
The equation C1V1 = C2V2 is used to compute the amount of solvent needed to dilute a concentrated solution to a given volume. You will be given examples to work on in other labs.
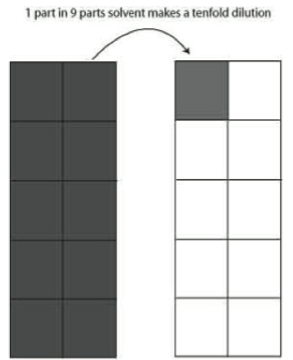
In today’s lab we introduce the 1:10 dilution as illustrated in Figure 4. Simply, if you have a solution you wish to dilute tenfold, you add 1 part of the solution you wish to dilute to nine parts solvent.This procedure can be extended to become a 1:10 serial dilution and with it a concentrated solution can be diluted to 1 part per million very quickly. The example below shows how an undiluted (1:1) solution can be diluted to 1 part per thousand in three steps. Show how a 1:1000 solution can be diluted to 1:1,000,000.
Serial Dilutions
1:1 —no dilution
1:10 —1 part in 9 parts solvent
1:100—1 part of a 1:10 dilution in 9 parts solvent makes a 1:100 dilution
1:1000—1 part of a 1:100 dilution in 9 parts solvent makes a 1:1000 dilution
Perform measurements of solutions (Steps 10-11)
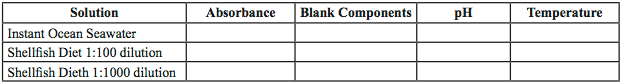
- Measure the absorbance of Instant Ocean seawater and the diluted shellfish diet at 600 nm using the spectrophotometer. Record data in EXCEL (Table 1).
- Measure the pH of your Instant Ocean seawater and the diluted shellfish diet using the pH meter. Record data in EXCEL (Table 1).
Table 1 Sample Measurement Table
Perform measurements of mussels (Steps 12-16)
- Obtain a glass culture dish and fill the dish with Instant Ocean seawater.
- Retrieve the mussels that you plan to use for your experiment and place them into the culture dish of seawater, add more seawater if necessary.
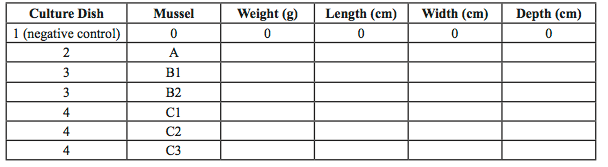
- Measure to the nearest 10th of a millimeter the length and width of each mussel using the Vernier calipers. Place your measurements in your class data table to compare the range of sizes of Mytilus edulis. Note how you took the measurements. Consider taking a picture of your mussels for your records.
- Use the balance to determine the weight of your mussels. Note how you took the weight measurements, did you gently blot the organisms on a paper towel first, for example?
- Record the data in your own EXCEL table (Table 2) and in the class spread sheet to compare the average weight of the mussels.
Table 2 Sample experiment data table. Record these measurements for all the mussels used in your experiment in this format
7.10 Activity 1C: Set Up and Run your Experiment
Procedure
- Set up the culture dishes with your planned seawater and food volumes (Figure 5).
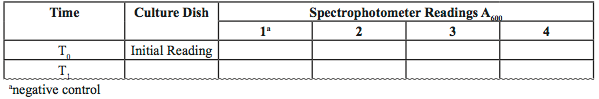
- Take an initial absorbance reading of the water in each dish.
- Start your experiment by adding mussels to the culture dishes. Collect the first data point and additional data if there is time. Record observations, especially of mussel behavior and consider taking pictures of your experimental setup.
If the amount of seawater and food is identical in all 4 culture dishes, what hypothesis is being tested here?
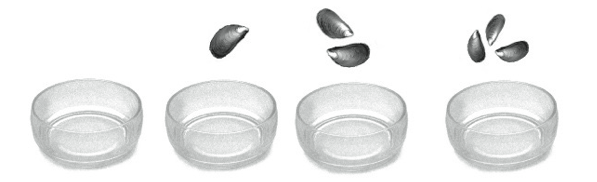
Table 3 Sample absorbance data table.
7.11 Data Analysis
- Graph your data in EXCEL (Table 3).
- Were there any trends in your data that indicate a direction for further experiments?
- Devise a Thought Experiment about ways you could modify the procedures in this experiment to find out more about bivalve feeding.
- Which tools are you most confident about using?
- Which tools require further practice?
- Present the results of your bivalve feeding experiment to the class.
7.12 Self-Assessment
These questions were taken from previous exams and are meant to represent a sample, not a complete study guide. The questions in these examples are designed to test your understanding of the concepts and skills presented in this lab, and your ability to apply what you have learned to novel problems.
1.
Computation: You have a stock of 3M NaCl. You want to make a 1M solution. You should mix ml of water with ml of the stock to get the final concentration.
2.
LOC: “Tare” a balance to
| A. |
| B. |
| C. |
| D. |
| E. |
3.
HOC: Sandra wants to measure the growth in size of an organism versus the amount of green algae they consume in a week. Which pair of instruments would Sandra most likely use for her experiment?
| A. |
| B. |
| C. |
| D. |
| E. |
Remember to visit the BLC to prepare for the Competency Exam