Chapter 11. LAB 11 Molecular Techniques II: Fingerprinting DNA
Learning Goals:
- Know what is meant by a DNA fingerprint and how DNA fingerprints can be produced through restriction enzyme digestions.
- Understand how agarose gel electrophoresis allows for the resolution of DNA fragments of differing sizes.
- Know the steps necessary to solve the case of the alleged “nosocomial infection” using DNA fingerprinting.
- Know how to retrieve nucleotide sequences from the NCBI GenBank database and use scientific software, such as NEBcutter, to produce DNA fingerprints made by specific restriction enzymes.
- Understand how to read a gel picture of DNA fragments and estimate fragment length using a DNA marker and migration distances.
Lab Outline
Activity 1: Restriction Digestion of
Plasmid DNA
Activity 2: Agarose Gel Electrophoresis
of Restriction Digestions
Scientific Inquiry

What do CSI, Bones, and NCIS have in common? They are television series that showcase forensic science—a field of science that uses many different scientific techniques to investigate legal issues. The popular media has capitalized on the wonders of forensic methods ever since DNA fingerprinting became an important source of court evidence in the early 1980s. Although forensic science itself is a rather old discipline (predating popular characters such as Sherlock Holmes), it was not until the dawn of DNA technology that it became a mainstream topic.
DNA fingerprinting was invented by a geneticist, Dr. Alex Jeffreys. In the late 1970s, Dr. Jeffreys was interested in detecting variations within human DNA. He began with the β-globin gene family because it was one of the few human genes characterized at the time. Now, about 35 years later, every human gene has been sequenced and mapped to a particular chromosome, but when Dr. Jeffreys started his work, very little was known about DNA sequences.
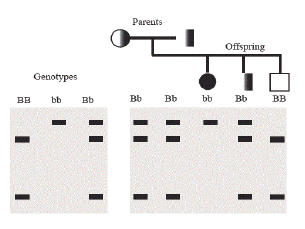
Dr. Jeffreys used restriction endonucleases (enzymes that cut DNA) and agarose gel electrophoresis to show variations in DNA lengths called restriction fragment length polymorphisms (RFLPs) at the β-globin locus (Jeffreys 2005). Some alleles of genes at the β-globin locus gave one pattern of DNA fragments, while other alleles from the same locus gave a slightly different pattern, due to changes in the size of the restriction fragments produced (Figure 1). However, these RFLPs did not work well for characterizing differences in alleles between humans.
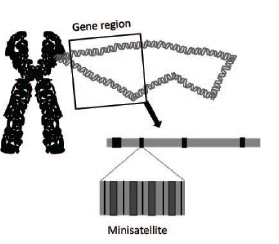
This led to the search for and discovery of genetic markers called minisatellite DNA. Minisatellites are short stretches of a repeating sequence (usually 10–30 base pairs) that occur in tandem (one right after the other) in many regions of the human genome (Figure 2). While the number of these repeats is highly variable, this variability is inheritable so that family members can easily be distinguished from non-family members. The pattern of these minisatellites that is produced after restriction digestion and agarose gel electrophoresis allows one to distinguish different individuals. Repeat, the pattern of these minisatellites produced after restriction digestion and agarose gel electrophoresis allows one to distinguish different individuals,using DNA samples only. The implications of this discovery were staggering.
The first test of this new technology involved an immigration case. A lawyer requested Dr. Jeffreys’ help in providing evidence that a young man from Africa was actually a woman’s son so that he would not be deported. Traditional blood tests showed that the woman and the boy were related, but could not show how closely they were related. Dr. Jeffreys was able to use these minisatellite markers and show that the woman was significantly more related to the boy than an aunt would be and the boy retained his citizenship (Jeffreys 2005). Subsequently, Dr. Jeffreys solved a double murder rape case in Leicestershire, England. DNA samples were collected from men in all the local pubs in the area. The original suspect was released because there was no match between his DNA and the DNA from the semen left at the scene. This was the first time that DNA was used to vindicate someone. The ability of DNA evidence to exonerate an innocent person spurred the formation of the Innocence Project in the United States in the 1990s.
Although DNA fingerprinting has advanced considerably through the invention of PCR and development of better DNA markers, the simple process of isolating DNA and mapping it with restriction enzymes and agarose gel electrophoresis that Dr. Jeffreys discovered is not outdated. These techniques are still commonly used even in the most sophisticated of molecular biology laboratories and they are still used forensically.
For example, if a bacterial infection breaks out at a hospital, and if the infection confers resistance to a particular antibiotic, it is most likely due to plasmid exchange between bacteria, since the plasmid usually contains genes that confer antibiotic resistance for its host bacteria. The bacteria are cultured and the plasmid DNA is isolated and digested with restriction enzymes to produce a plasmid fingerprint (Figure 3). If all of the plasmids isolated from the different infections produce the same restriction pattern, then the infection most likely originated from the same source and the origin of this source can be tracked with more advanced methods.
During this lab, you will work to solve a fictitious case using the same forensic analysis techniques that scientists use. You will also learn molecular biology approaches used to analyze recombinant DNA molecules. To this end, you will start with small rings of DNA called plasmids, which have already been isolated from bacterial cells. Plasmids are vectors commonly used for cloning genes, and most cloning procedures use the bacterium E. coli. A second important procedure in this technology is the digestion of plasmid DNA into manageable pieces with the use of restriction enzymes. Once your plasmid DNA is cut, you will size sort the fragments using gel electrophoresis and actually see the fragments in the gel using special stains. Gel electrophoresis allows you to sort DNA molecules by size and see the fragment patterns produced by restriction enzyme digestion.
Although plasmid vectors can be a source of DNA for forensic analysis, these rings of DNA can also be cut open with restriction enzymes, fused with a foreign piece of DNA and re-sealed with ligase, recreating a new and larger plasmid ring of recombinant DNA. This is gene-splicing, a technique for introducing new genes into a plasmid so the gene product can be produced by a host bacterium. Recombinant DNA molecules are inserted into a new host cell (usually E. coli) in a process called transformation. Transformation in a lab is the same process that occurs naturally in bacteria in the wild, plasmids are transferred from one bacterium to another with their genes, which often contain genes for antibiotic resistance.
In this lab, you will become a forensic scientist and provide information that will aide in a case of alleged harm due to a hospital-induced, or nosocomial, infection (Singh et al., 2006). The lawyer for the defendants states that their young daughter entered the hospital for a relatively simple operation. Her stay was prolonged due to the development of a bacterial infection that caused grave complications and required an additional surgery that was only partially covered by her parents’ insurance. The hospital is the plaintiff in this case, demanding full payment for the additional surgery. The parents believe the infection was nosocomial and report that there was a rash of such occurrences during their daughter’s stay. They report that everyone on their daughter’s floor had to gown up and wear masks before they entered this particular hospital ward. The hospital claims that the young girl’s infection is not related to that of any of the other patients and the mask and gowns were a precaution to prevent any spread of resistant bacteria.
Four different patients (A, B, C, and D) from her ward volunteered to be tested to determine if there was a common source of infection at the hospital. Your group will complete the forensic analyses for two of these samples (A&B, A&C, A&D, B&C, B&D, or C&D) to determine whether the plasmids isolated from the infectious bacteria is the same as the plasmids isolated from the infectious bacteria that led to the young girl’s complications. If your team can show that there is at least one other patient match, the court will mandate testing of samples from all the patients on that hospital ward.
Background
Restriction Enzymes
Restriction enzymes, also known as restriction endonucleases, catalyze double-stranded breaks in DNA molecules. You can think of them as very specific “DNA scissors” where each restriction enzyme binds to specific “recognition sequences” of nucleotides at cleavage sites. The recognition sequence for each restriction enzyme is palindromic, which means that it reads the same forward as it does backwards. Since DNA is double stranded, the sequence reads 5’ to 3’ on the top strand the same as it does 5’ to 3’ on the bottom, or complementary, strand. For example, the recognition sequence for the restriction enzyme PvuII is CAGCTG (Figure 4).
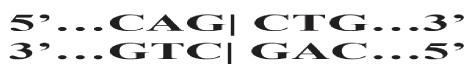
It reads CAGCTG going 5’ to 3’ on the top DNA strand and it reads CAGCTG when going 5’ to 3’ on the bottom DNA strand.
When PvuII cuts DNA, it cuts straight across from one DNA strand to the other, thus it makes a blunt cut. It cuts the phosphodiester bond between the G and the C going 5’ to 3’ on the top DNA strand and between the G and the C on the complementary strand. Not all restriction enzymes cut DNA this way. Some, such as BamHI with the recognition sequence G^GATCC, make staggered cuts in the DNA leaving what are known as sticky ends (Figure 5).
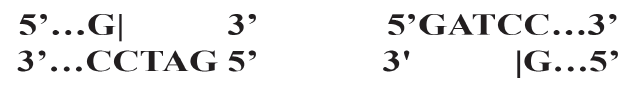
Any DNA molecule cut with BamHI can be joined together with any other DNA molecule cut with BamHI because the bases at the end of each cut will pair with each other. Restriction enzymes that leave cohesive, or sticky ends are restricted to pairing sticky ends with matching base pairs, whereas blunt ends cut with enzymes, such as PvuII, can match to any other DNA fragment with a blunt end, regardless of the enzyme that cut it. So, while ends produced by the restriction endonuclease BamHI are not compatible with ends produced by that of HindIII (another restriction enzyme that leaves sticky ends), ends produced by the two blunt cutters PvuII and EcoRV are compatible. The covalent joining of two different DNA molecules into a single continuous DNA molecule is the basis for recombinant DNA or cloning technology.
Agarose Gel Electrophoresis
DNA samples that have been digested using restriction enzymes usually contain a mixture of many billions of DNA fragments of different sizes. These fragments can be separated by size using a technique known as agarose gel electrophoresis, which not only separates DNA fragments by size, but also allows their visualization with the use of special dyes (Figure 6). Gel electrophoresis exploits the fact that DNA is negatively charged due to its phosphate groups—therefore DNA will naturally be drawn towards the positive pole in an electric field. The agarose gel is a porous, semi-solid that acts as a selective molecular sieve allowing smaller DNA fragments to pass through it more quickly than larger DNA fragments.
DNA samples mixed with loading dye are added to the wells at one end of the gel. An electrical current is applied across the gel, which drives the negatively charged DNA fragments away from the negatively charged cathode end of the gel towards the positively charged anode end of the gel—the shorter DNA fragments travel farther than the longer fragments.
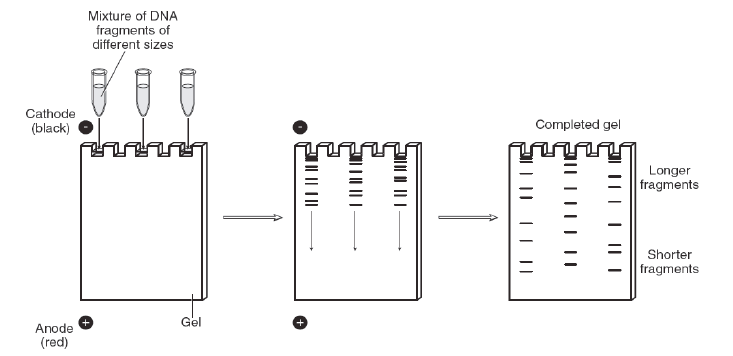
In preparation for electrophoresis, the agarose gel is immersed in a buffer. Loading dye is added to the DNA samples before they are injected into the wells of the agarose gel. Loading dye contains a viscous agent that keeps the DNA sample in the gel wells so it does not float out into the buffer. The loading dye also contains colored dyes that migrate similarly to certain DNA fragment sizes so we can tell how far the invisible DNA has travelled through the gel. When a voltage current is applied across the gel, the DNA fragments migrate through it from the negative towards the positive electrode and sort by size as they go. The longer (larger) DNA fragments reptate, or “snake,” through the porous gel material more slowly than shorter fragments.
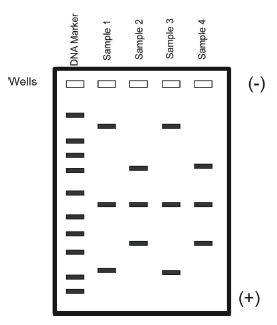
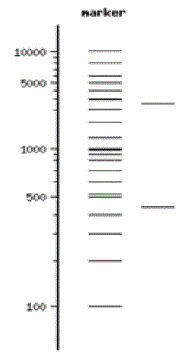
DNA itself is not visible during the gel run unless a fluorescent dye has been added to the agarose gel during its preparation and the gel is exposed to UV light. These dyes “squeeze” between the DNA bases and fluoresce green, orange, or gold when exposed to UV light depending on the type of dye used. The pattern of sorted DNA fragments on your gel should correspond to the DNA fragment sizes predicted by your restriction digestion calculations. You can record your results by taking pictures of the DNA fragments with conventional Polaroid photography or by digital imaging. One lane of your gel will contain a DNA marker that is made up of a mixture of DNA fragments of known sizes. The size of each unknown DNA fragment can be estimated by comparing it to the known sizes of the fragments in the DNA marker run in an adjacent lane of the gel (Figure 7).
You will use restriction enzyme analysis to analyze your plasmids isolated from the bacterial infections of patients A, B, C, and D and determine if they produce restriction patterns identical to that of the plasmid DNA sample from the bacteria isolated from the defendant. Would you expect identical DNA molecules to produce the same restriction map for a given restriction enzyme?
Resources
Crotty D.A., Freyer G.A., and Micklos D.A. 2003. DNA Science: A First Course in Recombinant DNA Technology, 2nd Edition. New York: Cold Spring Harbor Laboratory Press.
The Innocence Project. http://www.innocenceproject.org/ Accessed 2014 May.
Ish-Horowicz D. and Burke J.F. 1981. Rapid and efficient cosmid cloning. NAR. 9(13): 2989–2998.
Jeffreys A.J. 2005. Genetic Fingerprinting. Nature Medicine 11(10): 1035–1039.
Maniatis T., Sambrooke J., and Fritsch E.F. 1989. Molecular Cloning: A Laboratory Manual, 2nd edition. New York: Cold Spring Harbor Laboratory.
Pearson Education Inc., The Biology Place. 2008. Lab Bench Main, Lab 6: Molecular Biology. http://www.phschool.com/science/biology_place/labbench/ Accessed 2014 May.
Singh A. et al. 2006. Application of molecular techniques to the study of hospital infection. Clinical Microbiology Reviews. 19(3): 512-530.
University of Arizona. 2004. The Biology Project: Biotech Applied. http://www.accessexcellence.org/RC/AB/BA/ Accessed 2014 May.
Vincze T, Posfai J, and Roberts RJ. 2003. NEBcutter: a program to cleave DNA with restriction enzymes. Nucleic Acids Research. 31:3688-3691. http://tools.neb.com/NEBcutter2/index.php Accessed 2014 May.
Lab Preparation

Watch the vodcast and read this lab. Write all notes in your lab notebook. Complete the “Use of Software in Science” prelab assignment. There will be a Lab Quiz on this information.
11.1 Use of Software in Science
(Complete this assignment prior to lab)
Learning Objectives
After successful completion of this activity, you should be able to:
- Use scientific software, such as NEBcutter, to produce DNA fingerprints and virtual gels of specific DNA sequences (copied and pasted or retrieved from GenBank) with specific restriction enzymes (LO111)
- Label the sizes of standard bands in the DNA marker based on a key (LO112)
Use of scientific software programs for planning experiments and analyzing data is integral to the modern research process. If you plan to clone a gene, there are programs to help you determine which restriction enzymes would be best to use. But you need to know 1) the sequence of the gene and 2) the sequence of the plasmid that you plan to insert the gene into. You may be able to retrieve the gene sequence from the public government database at NCBI called GenBank. If the plasmid was purchased from a biological company, then you can probably copy and paste the sequence from their website.
Once you know the sequence of your DNA, you can use NEBcutter, software that is freely accessible on the Web, to produce a restriction map of your DNA. A restriction map is a list of every enzyme that you designate and the exact position it cuts your DNA. If you know the GenBank accession number for your DNA (this is the number whereby every DNA molecule in GenBank is cataloged), then NEBcutter will retrieve the DNA sequence for you. If you are interested in the restriction map of a particular piece of DNA for a given enzyme, then this software is an easy way to produce a virtual gel run of that result.
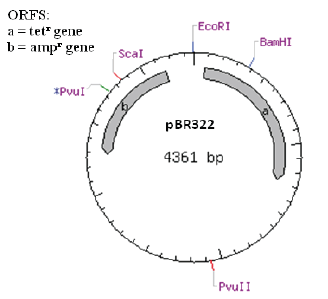
Prepare for this lab by performing a virtual digestion and agarose gel electrophoresis of a plasmid called pMC524/ MBM. This plasmid was isolated during the study of multi-drug resistant nosocomial Staphylococcus aureus (Bhakta and Bal 2003). This plasmid also replicates in E. coli.
- Access NEBcutter by going online and searching for the site or type in the URL http://tools.neb.com/ and click on the link for the software.
- Type in the pMC524/MBM GenBank number AJ312056 in the space provided (most sequence software, whether free or for purchase are linked to this site). Optionally, you can copy and paste the sequence for pMC524/MBM from GenBank or Blackboard into the box. If a sequence you are working with is not in GenBank, then you will need to copy and paste it into NEBcutter.
- Select “circular” because it is a plasmid and “all commercially available specificities” because you are only interested in enzymes that you can purchase if necessary. Leave the ORF (Figure 8) number at 100.
- Type the plasmid’s name in the space provided where it says “Name of sequence” (optional), otherwise the program will use the GenBank number as the name of the DNA molecule.
- Click Submit. What happens, and how is the sequence displayed?
- Save the page to a memory stick as NEBmap pMC524. You can do this in one of the following ways. Save as a webpage by going to the File menu on the web browser and selecting “save as” or “save page as.” You can also save it in PDF format by going to the Print menu under File and selecting Adobe PDF as the printer. You will be prompted to name the file.
- Digest pMC524/MBM with PvuII by clicking on Custom Digest in the Main options panel.
- In the box next to Pick this enzyme: type pvuii (Remember that the II in PvuII is Roman numeral I or i in the enzyme name). Click OK.
- Scroll down the page and look at the box next to PvuII. Is it checked? Could you have checked the box rather than write in the name of the enzyme?
- Digest the plasmid by clicking on “digest” in the menu. Explain what happens in your lab notebook. Save the picture as NEBmap pMC524 PvuII.
- Click View gel in the Main options menu. This software will produce a virtual gel, allowing you to visualize the fragments produced from digestion of pMC524/MBM with PvuII. Select the % agarose gel from the drop-down menu based on what you will use in the lab. Select the 2-log DNA ladder as your marker from the drop-down menu. Save the page to your memory stick as NEBgel pMC524 PvuII 2log.
- Look at the difference in migration of the DNA fragments on different percentage gels (0.7%, 1%, 2%, and 3%). What do you notice about the effect on the migration and separation of the DNA fragments, especially those in the marker? What does increasing the % agarose appear to do?
- Now repeat this process (virtual digestion of pMC524/MBM) with the restriction enzyme EcoRI by selecting New custom digests under Main options. Try other enzymes such as HindIII or SspI.
- In what way(s) is software like NEBcutter a valuable tool for a scientist as well as for undergraduate students.
- Print out a copy of your saved files and bring them to lab with you.
- If the DNA sequences of the plasmids from bacteria isolated from patients A, B, C, and D are available on Blackboard, how can you use NEBcutter to make restriction pattern predictions for these DNA samples?
Activity 1: Restriction Digestion of Miniprep DNA
Learning Objectives
After successful completion of this activity, you should be able to:
- Restriction digest DNA samples and diagram the process of DNA digestion of a plasmid or linear DNA molecule (LO116)
Materials
Plasmid DNA samples from bacterial cultures isolated from patients A, B, C, or D (provided)
500 μl microcentrifuge tubes (of different colors for identification purposes)
Micropipettes
EcoRI master mix (MM)—contains 2X EcoRI-compatible buffer and EcoRI enzyme PvuII master mix (MM)—contains 2X PvuII-compatible buffer and PvuII enzyme
37°C water bath
Microcentrifuge
6X loading dye (0.25% bromophenol blue, 0.25% xylene cyanol FF, 30% glycerol)
TE buffer (10 mM Tris, pH8, 1.0 mM EDTA)
Vortex
Ice

Procedure
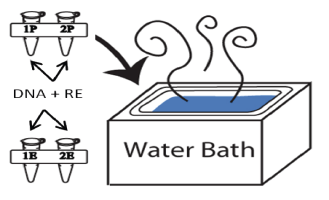
- Check that the water bath temperature is 37°C—the optimal temperature for the enzymes you will be using in today’s lab.
- Get your assigned plasmid DNA samples from your instructor. Thaw the samples and spin them briefly in the microcentrifuge to bring all the droplets to the bottom of the tube. If the volume of the DNA is less than 30 μl, see your instructor. Place the DNA samples on ice.
- Two group members will prepare the restriction digestions while the other two group members set up the prepoured agarose gel in the gel tank (Activity 2). Your lab instructor will prepare the defendant plasmid DNA.
- Label four 500 μl microcentrifuge tubes 1E, 1P, 2E, and 2P in which P stands for PvuII and E for EcoRI. Use one color tube for the PvuII digestions and the other color tube for the EcoRI digestions.
- Set up your restriction enzyme reactions with PvuII first according to the table. Please note that you are digesting plasmids isolated from bacterial samples from two of the four A, B, C, or D patients (A&B, A&C, A&D, B&C, B&D, or C&D). Each plasmid DNA will be digested with PvuII and EcoRI. Write in the table under Tube 1P and Tube 2P the corresponding patient sample letter (A, B, C, or D).
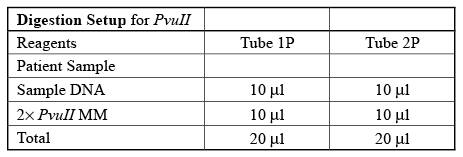
- Mix the contents by pumping the mixture up and down with the pipettor a few times. Shake the contents to the bottom of the tube, or spin briefly in the microcentrifuge using an adaptor tube. Will your DNA samples digest properly if some of this reaction mixture sticks to the sides of the tube?
- Place your two PvuII reaction tubes in the 37°C water bath (Figure 9) immediately. Do not wait until your EcoRI digestions are ready to incubate. Thirty minutes is the minimal time needed to incubate your samples and it is best if the PvuII samples incubate longer than the EcoRI samples.
- Prepare your enzymatic reactions for digestion with EcoRI according to the table.
- Mix the contents by pipetting up and down a few times. Shake the contents to the bottom of the tube or spin briefly in the microcentrifuge using an adaptor. Place your EcoRI reaction tubes in the 37°C water bath.
- Set your timer for 30 minutes. You will remove the PvuII samples and EcoRI samples at the same time.
- While your DNA samples are digesting, prepare your uncut DNA control samples. Label two tubes 1U and 2U for the uncut versions of your two plasmids. Pipette 6.5 μl of TE buffer into each of the two tubes followed by 1.5 μl of 6X loading dye and 2 μl of your uncut plasmid DNA.
- Complete Activity 3: DNA Model until your restriction digestions are ready.
- Once your restriction digestions are complete, add 4 μl of 6X loading dye to each of your samples. Use separate tips for each sample to prevent cross contamination.
What is the role of “master mix” in restriction digestion? What does the term “digestion” mean in the context of this lab? What will be the final concentration of loading dye in each of your samples?
Activity 2: Agarose Gel Electrophoresis
In this activity, you will use prepoured agarose gels. The gels are made by weighing solid agarose powder, placing it into a flask, adding gel electrophoresis buffer, and boiling the mixture in a microwave oven until the agarose powder dissolves. When the gel solution cools to the touch, a DNA-detection reagent called SYBR Safe is added to the molten agarose. The agarose is poured into a comb-containing gel-mold, and allowed to cool and solidify. You will place the prepoured gel in an electrophoresis tank, add buffer, add your dye-treated DNA samples to wells in the gel, and apply voltage to separate your DNA fragments.
Learning Objectives
After successful completion of this activity, you should be able to:
- Label the sizes of standard bands in the DNA marker based on a key (LO112)
- Draw a DNA fingerprint of a plasmid DNA cut with a restriction enzyme for which the position of the sites is known (LO113)
- Match materials and equipment for agarose gel electrophoresis with their function (LO114)
- Diagram the relationship between mapping an unknown plasmid to show how to solve a case of an alleged “nosocomial infection” using DNA fingerprinting (LO118)
Materials
Power supply
Pre-poured agarose gel
10x TAE (400 mM Tris-acetate, 10 mM EDTA) buffer, pH 8.3
500 ml and 50 ml graduated cylinders
Plasmid DNA cut with restriction enzymes
DNA marker
Horizontal electrophoresis tank with lid
SYBR Safe
UV Goggles
Gloves (provided by student)
Running the Agarose Gel
- Make 400 ml of 1x TAE from the 10x TAE provided.
- Remove the casting tray containing the pre-poured gel from the casting fixture by gently lifting it at one end.
- Place the gel-containing casting tray into the electrophoresis tank with the comb near the black electrode.
- Add 300 ml of 1x TAE running buffer to the electrophoresis tank until it just covers the gel. Gently remove the comb from the gel by pulling the comb straight up. Make sure the wells flood with buffer. The agarose gel is now ready for loading.
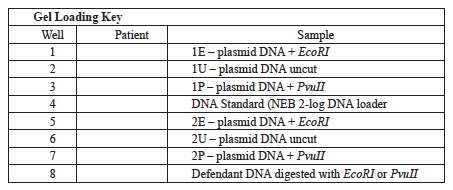
- Line up your samples that contain loading dye in a rack in the order in which they will be loaded on the gel. Watch your lab instructor demonstrate how to load the gel—they will load their “defendant” samples into your gels before you load your samples.
- Pipette 10 μl of each of your samples into the correct well according to the gel loading key table.
- Place the lid on the electrophoresis tank so that the connector covers make proper contact with the gold tank connectors.
- Attach the leads to the power supply properly (if the leads are color-coded, then place them red to red and black to black).
- Switch to the low voltage setting on the power supply. Turn on the power and turn the knob until the display reads 140 Volts. Make sure that you see a stream of bubbles coming up from the electrodes in the tank. If not, check your lead and lid connections.
- Run the gel until the line of bromophenol blue dye travels to about 2–3 centimeters from the bottom of the gel (3/4 of the distance).
- While the gel is running, complete Data Analysis Part A.
Viewing the DNA
- Turn off the power to the gel apparatus. Wear gloves and UV-rated goggles and remove the casting tray containing your gel. Place the casting tray on the transilluminator of the Gel Logic 100 and slide the gel off the tray into the slot area.
- Close the door to the Gel Logic 100 and turn on the ultraviolet light of the transilluminator.
- Follow the posted instructions for the Gel Logic 100 to preview and capture an image of your gel containing DNA fragments. Be sure to invert the image on the computer screen using the software, so that the bands appear black on a white background. Save your gel picture to your section folder on the desktop in graphic format (TIFF or JPEG). Your instructor will print out a copy of your group picture, four per page, and post all gel pictures on the course website.
- Discard your gel in the proper waste container once you are done (make sure you saved the picture prior to tossing your gel).
- Complete Data Analysis Part B.
Activity 3: Exploring DNA with the DNA Discovery Kit©
In this activity your group will cooperate with the rest of the class to build a DNA model. You will also simulate the plectonemic nature of double-stranded DNA using toobers.
Learning Objectives
After successful completion of this activity, you should be able to:
- Label a picture or model of DNA of important chemical components and groups and bonds (LO109)
- Explain the different types of DNA in bacteria (plasmids vs. chromosomal (LO110)
Procedure
Nucleotides and Polynucleotides
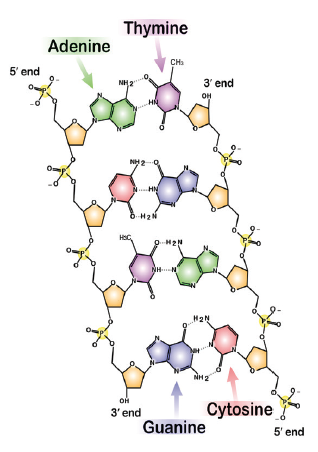
- As a group, take one of each of the four nucleotides A, T, C, and G from the DNA Discovery Kit©. Compare them; which parts of each of the nucleotides are the same, and which are different?
- Review the names and locations of the major components that make up a nucleotide. Compare the appearance of a picture of the nucleotide to the model of the nucleotide (Figure 10). In what ways does the picture of the nucleotide look different from the model of the nucleotide? What kind of bond joins the phosphate, sugar? What kind of bond joins the base to the sugar?
- Join all possible combinations of two nucleotides together as a single strand of DNA (i.e., do not base pair the nucleotides). How many possible dinucleotides can be formed?
- What is the name of the bond that forms between the two nucleotides and what chemical groups are involved in the bonding?
- Now add the other two nucleotides to this pair and construct a tetra (four) nucleotide single stranded DNA molecule. How many possible tetranucleotides can be formed and what implications, if any, does this have for encoding genetic information?
- How stable do you think a single stranded polynucleotide is? How easy do you think it would be to break it up into separate nucleotides or into its components of phosphates, sugars, and bases? Notice the orientation of one nucleotide with respect to the next one as you build the polynucleotide (single-stranded DNA). What overall shape does the polynucleotide take? Are both ends the same or different?
Building a double-stranded DNA helix
- Examine the bases in the DNA Discovery Kit©. Notice that in addition to the place where the base can be joined with the sugar, there are also magnets on the red oxygen, blue nitrogen, and white hydrogen. They represent the tendency of these atoms to form “hydrogen bonds”—O with H–N, and N with H–N or H—O.
- Now make base pairs between all the possible bases (purines–purines, pyrimidines–pyrimidines, purines–pyrimidines). Do you discover 12 non-redundant pairings? How many of these base pair hydrogens bonded using this model?
- Can all these possible nucleotide pairs be used to construct a double-stranded segment of DNA? If not, which ones can? How many different sequences can you construct using six nucleotides?
- Can you construct a segment of double-stranded DNA in which the backbone of both strands run antiparallel to one another? How about parallel to one another?
- Try constructing a double-stranded DNA molecule on the model stand. Begin by placing your group’s hydrogen-bonded nucleotides on the stand. Each group will add their base pairs one after the other. Your DNA molecule should begin to look like a spiral staircase of polynucleotides with the nucleotides hydrogen bonded to each other forming base pairs.
Exploring the structure of double-stranded DNA
- Do the nucleotides in the double-stranded DNA helix follow Chargaff’s rule?
- What is holding the two DNA helices or strands together?
- Are the sugar and phosphate groups present on the inside or outside of the helices? How is a nucleotide in one helix connected to a nucleotide adjacent to it in the same helix? Is this what you observed when you made single-stranded polynucleotides earlier? What bond connects the sugar in one nucleotide to the phosphate in the adjacent nucleotide?
- Follow the sugar-phosphate backbone along one helix. How do the paths of the two helices compare to one another if you traverse each helix going from phosphate to sugar to phosphate to sugar in the backbone? Which helix is oriented 5’ to 3’ traveling top to bottom, and which helix is oriented 5’ to 3’ traveling bottom to top? Hint: The 5’ end of the sugar has the phosphate group attached to it. Why is an understanding of DNA orientation important? Hint: Is there a particular way in which DNA is replicated? transcribed?
- Move your right hand upward along the double-stranded DNA helix model. Does the double-stranded helix curve to the right or to the left? If it curves to the right, then this DNA model forms a right-handed helix. Why should the helix orientation matter?
- How many base pairs are there in a complete 360° turn? If you place your finger at the first base pair of the DNA model and trace along the double-stranded DNA for one 360° turn with your other hand, you will find _____ base pairs per turn.
- As you follow the grooves along the side of the double-stranded DNA helix, do you notice that the groove on one side of the DNA staircase is larger than the other? These are known as the major and minor grooves of DNA. Why are the grooves unequal in size? Hint: How are the sugars positioned relative to the nucleotide bases—are they positioned in line with the bases or at an angle? What role do the grooves play? Hint: How do proteins specifically bind DNA?
- Your instructor will demonstrate the plectonemic nature of double-stranded DNA using toobers and discuss types of DNA molecules in bacteria.
Data Analysis

Part A Complete this during the gel run.
- Your instructor will give you a copy of the data analysis A worksheet. The worksheet contains a gel picture of the plasmid isolated from the defendant’s bacterial infection in uncut form and after digestion with both EcoRI and PvuII. The worksheet also contains a table of the size and location of EcoRI and PvuII restriction sites for the plasmids, A, B, C, and D isolated from bacterial infections from the four patients.
- Estimate the size of the DNA fragments on the gel picture as follows, writing necessary information in your lab notebook:
- Label the fragment sizes of your DNA standard using the marker key by going to the New England BioLabs website and searching for the 2-log DNA ladder.
- Measure the distance in millimeters that each fragment traveled starting at the base of the wells (for the EcoRI digestions and the PvuII digestions).
- Focus on one fragment at a time and locate its position between two of the known DNA markers that the fragment of interest migrated between. Measure the distance that these known DNA fragments traveled from the well.
- Your unknown fragment traveled between these two known fragments so you can use ratios to compute the size of your unknown DNA fragment (see Box 1 for directions on how to estimate fragment size).
- Use the tabled information from your data analysis A worksheet to determine the expected number of fragments for your two plasmids after digestion with EcoRI and PvuII.
- Calculate the size of each of the fragments.
- For your samples 1, label the lanes on one of the schematics of a gel with 1E and 1P. For your sample 2, label the lanes in the other schematic, 2E and 2P to distinguish the samples and the restriction enzymes used to digest them.
- Draw bands in each of the gel lanes relative to the 2-log DNA standard in the third lane to show the predicted migration of your DNA fragments for each digestion. Your instructor will assist you with this activity.
- Use your completed Data Analysis A worksheet to assist you with completion of Data Analysis Part B.
Part B Complete this following the gel run.
- Your instructor will give you a print out of a picture of your gel.
- Label the lanes of each well and note the lanes that show the presence of DNA fragments.
- Label the fragment sizes of your DNA standard using the marker key from the New England BioLabs’ website.
- Take notes in your lab notebook that include all the following observations:
- Did you isolate plasmid DNA from each of your bacterial cultures? If not, explain why you did not see DNA on your gel. If DNA is present, what is the relative amount of DNA present between your two plasmid DNA samples? The density of the DNA bands are related to the amount of DNA present, so dark bands (▬) contain much more DNA than faint bands (─). Estimate by eye.
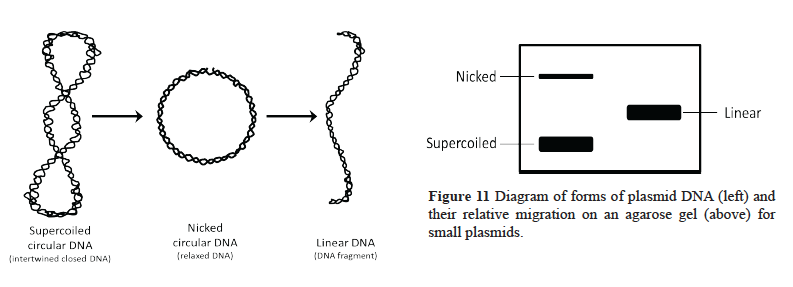
- Did your DNA samples digest with the restriction enzymes? Compare your digested DNA samples with the undigested DNA controls to determine if the restriction enzymes cut your DNA. Please note that you cannot use the marker to determine the size of the uncut DNA. The uncut DNA is in a closed, circular form while the digested DNA is in a linear form like the marker. Plasmid DNA usually exists in one of three forms: supercoiled, linear, or relaxed (nicked) (see Figure 11). You must compare the same forms with each other when estimating size (linear with a linear marker or supercoiled with a supercoiled marker, etc.).
- What % of each plasmid DNA sample was digested? You have hundreds of billions of DNA molecules present in each of your reaction tubes. Compare the species in the control lane with those in your digested lanes to determine if any of your restriction enzyme-treated DNA is still present in uncut form. Estimate how much of your DNA is no longer in the uncut form.
- Create a raw data table that references your gel picture in which you include the number of fragments and their estimated fragment sizes for each digestion. Include the theoretical number of fragments and fragment sizes to make comparisons.
- In a paragraph, discuss the conclusion of your forensic analysis with supporting evidence based on your data and instructor control sample. Do any of your plasmid DNA samples give a DNA fingerprint similar to that of the defendant’s plasmid DNA sample? If your plasmid did not digest with the restriction enzyme, use data from that of another group that digested the same plasmid.
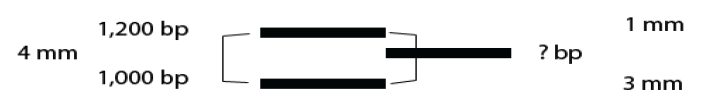
Box 1 Estimating the Size of DNA fragments
The distance (D) that a DNA fragment migrates is inversely proportional to the log of its molecular weight (MW) or number of base pairs (bp): D = 1/log MW. In other words, the relationship is logarithmic, distance traveled on the x-axis is proportional to the inverse of the log of the molecular weight on the y-axis.
In this lab, we ask you to estimate the size of your DNA fragments using a linear scale. The linear estimation works mainly because we are comparing one fragment with the two known fragments it migrated between rather than estimating it from a standard curve that incorporates all the known fragments of your DNA marker. Let’s assume that your fragment traveled between two marker DNA fragments of 1,000 bp and 1,200 bp in size. Before you can estimate its size, you need to know the distance traveled for each fragment.
- Your unknown traveled 55 mm from the well, the 1,000 bp fragment traveled 58 mm from the well, and the 1,200 bp fragment traveled 54 mm from the well. Note that the larger the fragment the shorter the distance it travels.
- How far is your fragment from the 1,200 bp DNA fragment in mm? From the 1,000 bp fragment in mm? Your fragment traveled 3/4th the distance between the marker fragments or 3 mm from the 1,000 bp fragment and 1 mm from the 1,200 bp fragment (Figure 12).
- How does that distance translate into base pairs? There is a 200 base pair difference between the 1,200 bp fragment and the 1,000 bp fragment over a distance of 4 mm (58 mm–54 mm) between them. Each mm therefore represents approximately 50 bp (200 bp / 4 mm or 50 bp / mm).
- If the unknown fragment is 3 mm from the 1,000 bp fragment, then it is ~150 bp (3 mm * 50 bp/mm) larger than that fragment or 1,150 bp in size. Alternatively, it is 1 mm from the 1,200 bp fragment, ~ 50 bp smaller than that fragment or 1,150 bp.
11.2 Self-Assessment
These questions were taken from previous exams and are meant to represent a sample, not a complete study guide. The questions in these examples are designed to test your understanding of the concepts and skills presented in this lab, and your ability to apply what you have learned to novel problems.
1.
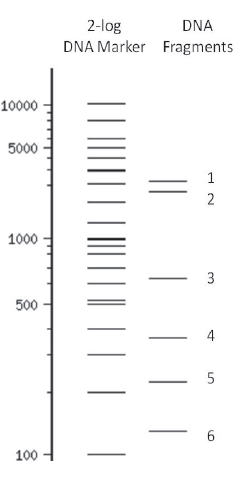
Computation: Select one of the DNA fragments (1-6) shown in the virtual gel picture and estimate its size using the 2-log DNA marker in lane 1.
| 1 | |
| 2 | |
| 3 | |
| 4 | |
| 5 | |
| 6 |
2.
LOC: You add loading dye to the DNA when using agarose gel electrophoresis to separate DNA fragments. Why is the loading dye added?
| A. |
| B. |
| C. |
| D. |
| E. |
3.
HOC: Which of the following statements about the size of fragments is correct?
| A. |
| B. |
| C. |
| D. |
| E. |