Chapter 1. LAB 4 Biological Data 2: Observations and Measurement
Introduction
Learning Goals
- Understand evolutionary adaptations of plants
- Understand environmental stresses that influenced evolution of particular adaptations by natural selection
- Know how to make comparisons between plants
Lab Outline
Activity 2: Explorations in the Greenhouse
1.1 Scientific Inquiry
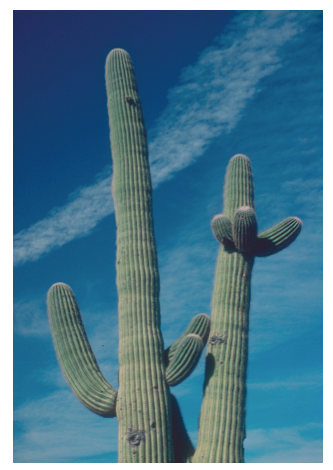
When you look out the window, what kinds of plants do you see? Can any kind of plant live in your neighborhood? If you live in New York, would you expect to see a giant saguaro cactus (Figure 1) growing in your front yard? It’s unlikely because saguaro cacti have adapted to extreme hot and arid conditions like those found in the Sonoran Desert where it evolved—it is not adapted to cold, wet New York winters. On the other hand, plants that commonly grow in New York would probably have difficulty surviving in the desert. Plants usually live in certain environments because they have evolved genetic traits on a geological time scale that allow them to survive in that habitat. These acquired traits or adaptations that make a plant well suited for one habitat usually compromise its fitness in another habitat.
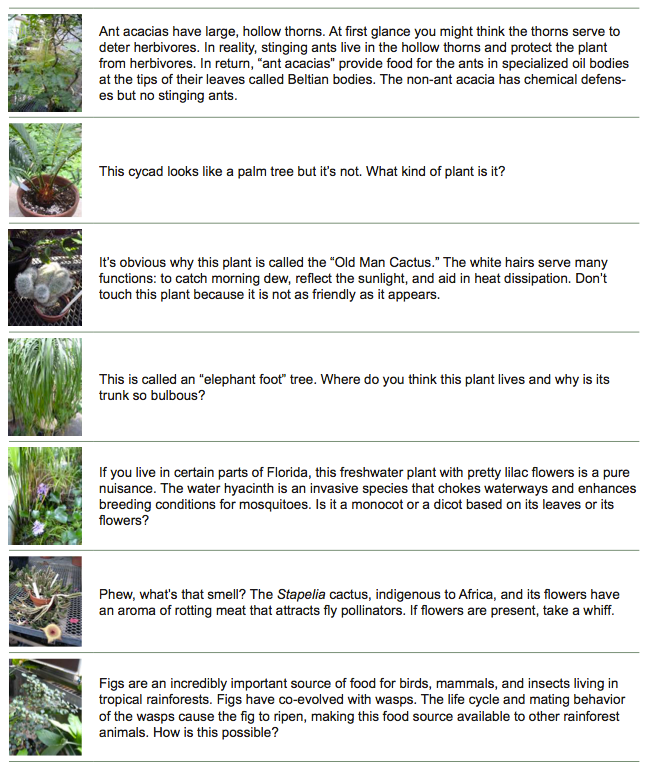
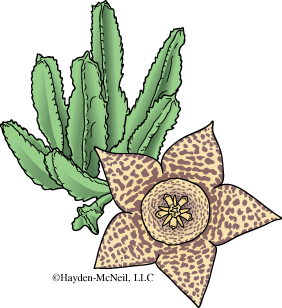
Plants have evolved particular adaptations in various ways, but these changes through time did not occur in a vacuum. Plants have adapted through their interactions with the physical environment and with other organisms including insects, birds, mammals, fungi, and other plants. For example, many flowering plants have coevolved with specific animal pollinators. Coevolution occurs when two ecologically interacting species influence each other’s characteristics. Flowers have evolved over time to be more attractive to their pollinators. Pollinators visit flowers for the rewards that they receive, such as nectar, wax, or pollen. Some flowers are attractive to pollinators because they are colorful or are anatomically well suited to the specific feeding habits of the pollinator. Flowers pollinated by hummingbirds are often red and elongated; the red attracts the birds and the shape of the flower matches the hummingbird’s beak and tongue. Some flowers, like the members of the genus Stapelia (Figure 2), produce scents that resemble rotting flesh to attract fly pollinators.
Although coevolution of flowers and their animal pollinators can be successful at some time in their life history, such dependency can be extremely detrimental for the plant if the pollinator shifts its territory or becomes extinct. A classic example of this is Brighamia, a genus of plants endemic to the Hawaiian Islands. There are only two species in this genus and the plants are naturally found on sea cliffs on three Hawaiian Islands. Brighamia is endangered; only about 200 individuals of this plant are known to exist. Not only has it evolved adaptations for life on sea cliffs, it has also coevolved with the hawkmoth as its specific pollinator. Hawkmoths have recently become extinct. In order to preserve this plant, conservation biologists climb down high, steep sea cliffs to pollinate these plants by hand, otherwise the plant is doomed to extinction (USBG 2008).
In an earlier lab you learned the basic plant organs common to the angiosperms (roots, stems, leaves, flowers, and fruits). In this lab you will observe and interpret the amazing shape, size, and color modifications of these basic organs that plants have evolved to adapt to their particular way of life.
1.2 Background
Natural selection results in plant adaptations that enable them to survive and reproduce in their local climates. Many factors affect plants, including temperature, water availability, nutrients, and sunlight. Plants have also evolved structural adaptations for survival under existing, and often extreme, environmental conditions—they can survive and reproduce even though they are subject to freezing, drought, and periods of low light. The focus of this lab concerns the strategies plants use to survive environmental extremes and extend their ranges.
A wide range of terrestrial and aquatic habitats exist on earth. Tropical rainforests, deserts, temperate forests, grasslands, and tundra are biomes. Marine, aquatic, or semi-aquatic environments are found in seas, ponds, wetlands, and bogs. Climatic conditions limit the kinds of plants that can live in a particular environment. For example, temperate deciduous forests on Long Island survive freezing in winter by shedding their delicate leaves and entering dormancy in the fall. The lush growth of vegetation seen in the spring and early summer reflects rising temperatures and abundant precipitation. This habitat can sustain growth of large, leafy trees. Those parts of the United States receiving substantially less rainfall often support smaller plants with less woody growth and fewer herbaceous plants.
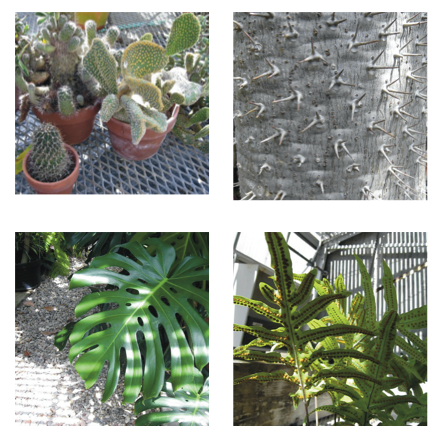
The range of adaptations displayed by different plants in a particular environment are often the result of selective pressures from abiotic factors such as light, wind, extreme temperature, precipitation, and minerals. Be aware of the limiting factors affecting survival in particular environmental regimes; these insights will help you understand plant structures that aid in survival. You will observe plants from tropical, arid, and aquatic habitats in the Life Sciences Greenhouse. The information in this lab will help you focus on the environmental stresses that plants face in specific environments.
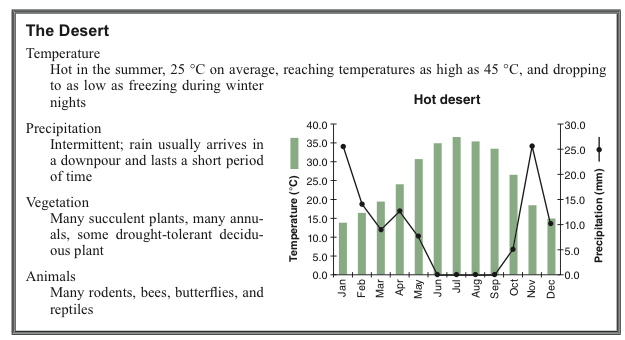
Deserts are typically dry, averaging less than 30 mm of rain per year, with some reaching temperatures as high as 110 °C. Vegetation in hot deserts is often sparse but rather unique. These plants, called xerophytes (xerofor dry), are adapted to hot, dry habitats. They frequently have water conservation adaptations to absorb and store water, as well as prevent water loss. Many have large photosynthetic stems that store water in their succulent tissue (see Figure 2). Often one large stem supports the weight of the succulent tissue. It is usually spherical in shape which maximizes volume but minimizes surface area. The outer skin is usually tough and waxy to prevent water loss. Leaves are often absent and replaced with spines. Both spines and pubescence (hair) aid in heat dissipation and deter herbivory. The root systems in xerophytes vary for different water access strategies—deep taproots burrow into the soil and access underground water while others have fibrous roots with many hairs, some of which are shallow enough to quickly absorb moisture from morning dew or from brief rain showers. Other root systems possess water-storing tubers. Photosynthesis usually occurs in the stem, and specialized photosynthetic pathways make it possible for gas exchange to occur at night, when it is cooler and less water is lost.
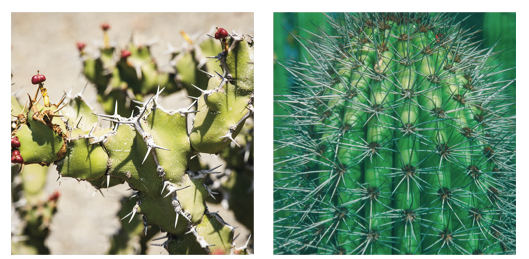
Be careful because looks can be deceiving: African euphorbs and American cacti (Figure 3) share similarities such as spines and their succulent stems (structures that store water). However, these specialized organs are not homologous structures, meaning that these plant taxa do not share a common ancestor—their succulent stems evolved independently in similar biomes in separate evolutionary lines. The process that leads to similar features in unrelated taxa is called convergent evolution. Biologists who try to unravel evolutionary relationships among organisms must be wary of the possibility that a particular shared feature may not be due to common ancestry, but may be a consequence of convergence.
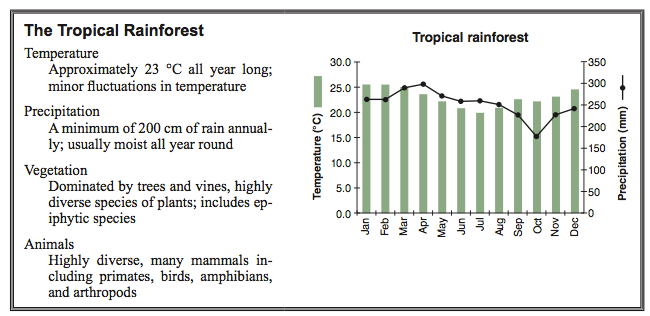
The tropics contain the most diverse populations of flora and fauna in the world, most of which have yet to be discovered and cataloged (Figure 4). The understory of a rainforest is relatively sparse because the sunlight that penetrates the dense canopy is not sufficient to support much undergrowth. Most of the life in a rainforest exists far above the forest floor in the subcanopy and canopy. One study of a Peruvian rainforest identified about 300 species of trees in a one-hectare (~2.5 acres) plot—compare this to the 700 tree species found in the U.S. and Canada combined. The diversity of tropical animals is equally dazzling: a researcher collected all the ants he could find on a single tree in Peru and identified 43 species, roughly half of the ant species found in all of Long Island, NY. As a final example of exceptional biodiversity in the tropics, in Colombia, South America (a country twice the size of Texas), there are more than 1,500 breeding bird species—two and a half times the number in the entire U.S.
The constant presence of heat, moisture, and the density of plant life in the rainforest insures that the nutrients in the detritus is recycled so quickly that there is virtually no accumulation of dead plant matter on the forest floor—as a result, nutrients are not stored in the rainforest soils. How do these plants survive in such nutrient-poor soil? In addition to heavy rain, tropical plants must be able to withstand the gale-force winds that accompany tropical storms, like hurricanes and monsoons. Many tropical plants have evolved leaves that rip in the wind, rather than break stems or limbs, which would destroy the plant. Most tropical leaves have an elongated tip, called a drip tip, that causes water to quickly roll off the leaf to prevent rotting.
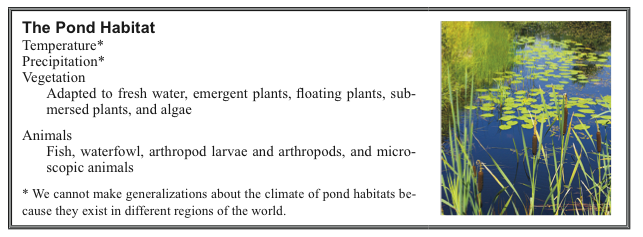
The common ancestor of all land plants was an aquatic green algae-like organism. Many plants still live in or around watery environments. Plants that are completely immersed in water must stay afloat or grow only near the surface to have access to sunlight for photosynthesis. They must also adopt methods for obtaining minerals and oxygen so their roots can respire, since gases do not dissolve well in water.
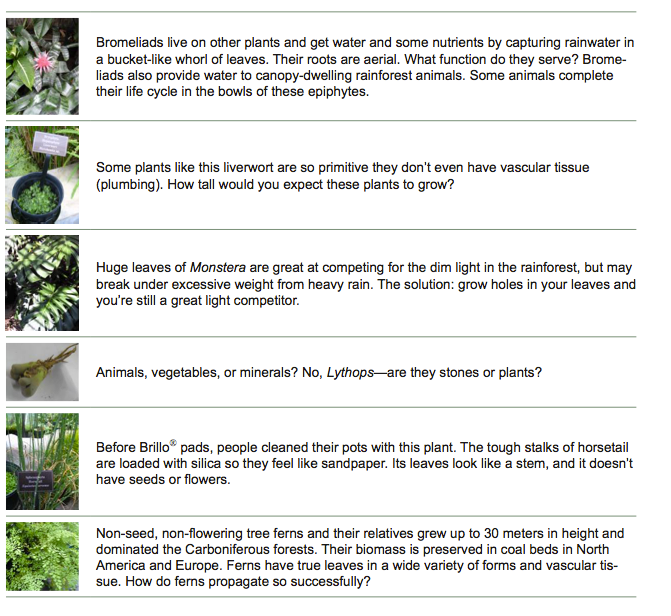
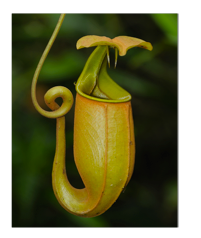
Some aquatic plants possess aerenchyma tissue that is filled with air and helps gas exchange in plants subjected to flood conditions. Some plants, such as mangrove trees, have pneumatophores, which are roots that protrude into the air to facilitate gas exchange in the submerged mangrove root systems. Nitrogen is not readily available to plants living in acidic bog habitats, so some plants, like pitcher plants (Figure 5), have become “carnivorous.” They capture and digest animals (usually insects) to obtain their nitrogen.
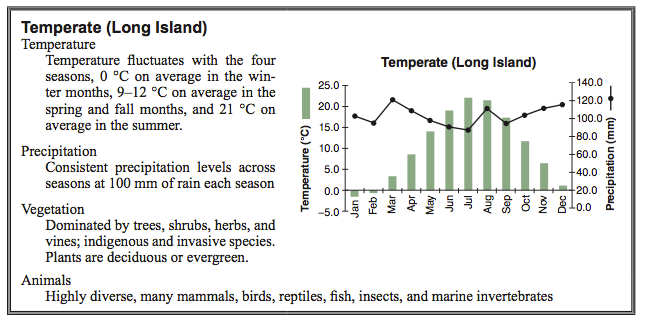
Plants living in temperate climates are subject to seasonal variation. Winters with periods of frost or extreme cold mark a period of dormancy with little plant physiological activity. When spring arrives and temperatures predictably remain above freezing, seeds and buds emerge from dormancy and begin a new period of growth. Generally, herbaceous plants emerge on the forest floor before the forest canopy leafs out and cuts down on the amount of solar radiation received by the forest floor. Summer is generally a period of active plant growth when many plants respond to changing fall conditions by losing structures such as leaves that are vulnerable to frost damage.
1.3 Resources
1.4 Lab Preparation
Lab Preparation
Watch the vodcast and read this lab. Write all notes in your lab notebook.
1.5 Activity 1: Land Plant Cladogram
Learning Objectives
After successful completion of this activity, you should be able to:
LO38 Describe and explain the placement of synapomorphies on a plant cladogram
LO39 Recognize and point out synapomorphies on living specimens
Materials
Dissecting microscope and lamp
Plant specimens from plant taxa Angiosperms, Gymnosperms, Pteridophyta, and Bryophyta
Plant parts, prepared slides, and posters to display entire life cycle representative of a given taxon
Wax paper squares
Water
Transfer pipettes
Flashlight
1.6 Activity 1 Procedure
You will share plant specimens and slides with the adjacent lab group to complete this activity.
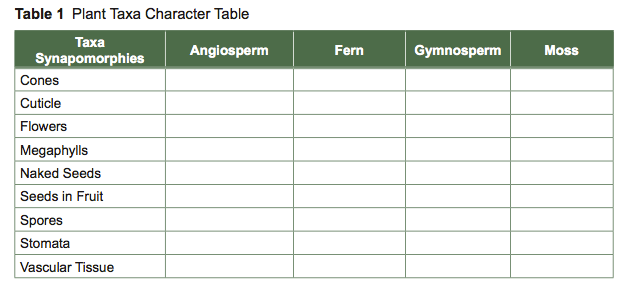
- Draw a table in your lab manual similar to Table 1 below.
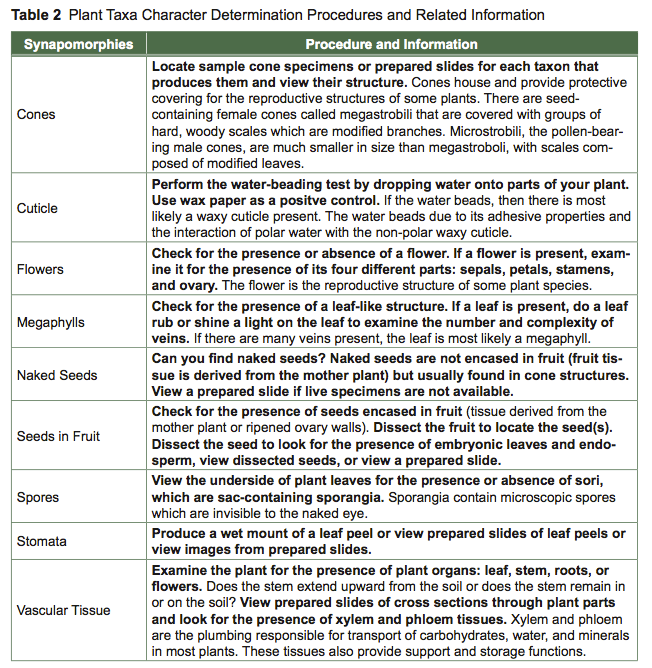
- Select a plant from each category and share observations of the features listed in the character table (Table 1) by following the procedures listed in Table 2 to observe each character. Some observations may require the use of a compound microscope but most of your observations may be made quickly by eye or with a dissecting scope.
- Place a “+” sign in your table cell if the character is present for a particular plant or a “–” sign if the character is absent. You can also devise your own scoring system.
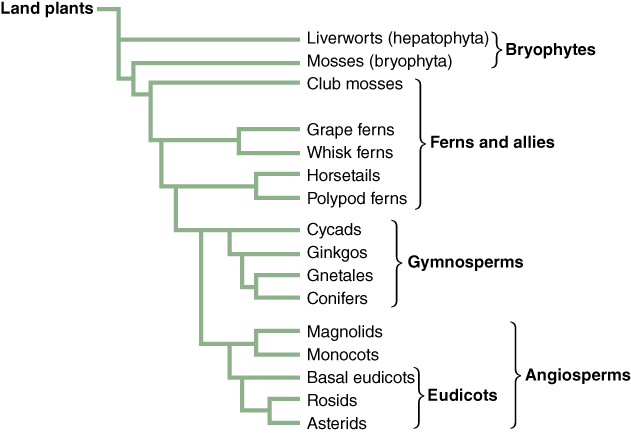
- Fill in Table 1 and use it to properly place the characters on the cladogram in Figure 6.
- Compare your cladogram with that of the other group’s cladogram. Where did you position your characters: at a node (branching point), across a branch, before a node, etc.?
1.7 Activity 2: Explorations in the Greenhouse
When you enter the Life Sciences Greenhouse at Stony Brook you will be surrounded by a variety of plants from around the world (visit the course website for a map of the Greenhouse). Try to make connections between the stresses plants experience in their natural habitats and the adaptations they have evolved to survive. Apply this knowledge to specific inquires of plant comparisons and collect both qualitative and quantitative data.
Your group will be assigned one exploration module in which you compare two plants. You should answer the questions associated with each module and collect qualitative and quantitative data. Discuss with your instructor the data you will collect prior to leaving for the Greenhouse. Plan to sketch your plants or take digital pictures with sufficient detail to enable you to make comparisons between the two plants.
Learning Objectives
After successful completion of this activity, you should be able to:
LO44 Compare and contrast adaptive characteristics between two or more plants
LO45 Support answers to questions about plant adaptations with qualitative and quantitative data
LO46 Describe structure/function relationships for organs of greenhouse plants even if modified
Exploration Module 1
Compare a bromeliad and a succulent, plants that have adaptations for storing water.
- What are the plant species names and in what habitats are they usually found?
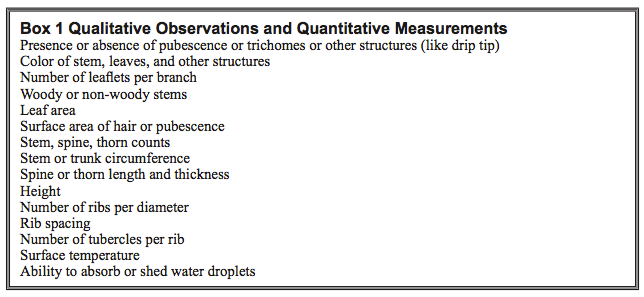
- What are some defining characteristics of the plants? Record your qualitative observations. Collect quantitative measurements for at least two different attributes that allow use, minimally, of the Vernier caliper. In your sampling, take multiple specimen measurements (e.g., areas of several leaves, etc.). See examples listed in Box 1.
- What are the specific ways in which these plants store water?
- What role(s) does this adaptation serve for each plant?
- Does the adaptation provide an advantage to other living organisms? Explain.
- What are some inferences or conclusions you can make in your plant comparisons?
Exploration Module 2
Compare a stone plant with another plant found in a similar habitat.
- What are the plant species names and in what habitats are they usually found?
- What are some defining characteristics of the plants? Record your qualitative observations. Collect quantitative measurements for at least two different attributes that allow use, minimally, of the Vernier caliper. In your sampling, take multiple specimen measurements (e.g., areas of several leaves, etc.). See examples listed in Box 1.
- What are the specific ways in which these plants prevent herbivory?
- What are the specific ways in which these plants prevent water loss? Overheating?
- Which plant organ performs photosynthesis for this plant?
- What are some inferences or conclusions you can make in your plant comparisons?
Exploration Module 3
Compare two trees found in the greenhouse.
- What are the tree species names and in what habitats are they usually found?
- What are some defining characteristics of the plants? Record your qualitative observations. Collect quantitative measurements for at least two different attributes that allow use, minimally, of the Vernier caliper. In your sampling, take multiple specimen measurements (e.g., areas of several leaves, etc.). See examples listed in Box 1.
- Do these trees possess woody stems? Do they branch?
- If a tree comes from a windy tropical region, how does it prevent snapping in high storm winds?
- How do these trees compete for sunlight?
- How do these trees reproduce?
- What are some inferences or conclusions you can make in your plant comparisons?
Exploration Module 4
Compare a pond plant with a carnivorous plant, plants that are often living in nutrient-poor environments.
- What are the plant species names and in what habitats are they usually found?
- What are some defining characteristics of the plants? Record your qualitative observations. Collect quantitative measurements for at least two different attributes that allow use, minimally, of the Vernier caliper. In your sampling, take multiple specimen measurements (e.g. areas of several leaves, etc.). See examples listed in Box 1.
- What adaptations are specific to their particular needs or habitat?
- What are some specific ways in which these plants acquire nutrients?
- Do both plants carry out photosynthesis? Explain.
- What are some inferences or conclusions you can make in your plant comparisons?
Exploration Module 5
Compare two “economically important” plants.
- What are the plant species names and in what habitats are they usually found?
- What are some defining characteristics of the plants? Record your qualitative observations. Collect quantitative measurements for at least two different attributes that allow use, minimally, of the Vernier caliper. In your sampling, take multiple specimen measurements (e.g., areas of several leaves, etc.). See examples listed in Box 1.
- What type of fruit does each of these plants produce? How is that fruit naturally dispersed?
- What anatomical features, if any, do the plants possess to prevent predation?
- What adaptive features are shared by these two plants? Explain.
- What are some inferences or conclusions you can make in your plant comparisons?
Exploration Module 6
Compare a plant with pubescence (hair) to a plant with thorns or spines.
- What are the plant species names and in what habitats are they usually found?
- What are some defining characteristics of the plants? Record your qualitative observations. Collect quantitative measurements for at least two different attributes that allow use, minimally, of the Vernier caliper. In your sampling, take multiple specimen measurements (e.g., areas of several leaves, etc.). See examples listed in Box 1.
- What function(s) do these adaptations serve?
- Is the adaptation derived from the same plant organ?
- Are these adaptations related to the habitat in which these plants are found? Explain.
- What are some inferences or conclusions you can make in your plant comparisons?
Select at least two qualitative observations and two quantitative measurements for data collection from Box 1 or choose your own. Collect several data points for each observation and measurement. For example, if you measure spine length, you should measure the length of at least 5–7 spines over the entire plant, possibly 2 per each of 3 ribs. Why is it important to collect more than 1 or 2 data points per observation or measurement?
Self-Test Practice (Complete Outside of Lab)
One of the Greenhouse bays has been set aside for self-testing of your ability to make observations and apply your knowledge of plant anatomy and adaptations to specific problems or questions about plants. Visit this bay and answer the questions posed with the demonstration plants. Similar kinds of questions may appear on an exam.
1.8 Data Analysis
Communicating Findings
An integral component of all biology labs, emphasized strongly in this lab, is learning and perfecting the skill of making observations. Observations that cannot be understood and reproduced by others are not useful to the scientific process. For example, if you sketch an area of a forest on campus to catalog plant life abundance, but you omit a figure legend or a key to your scale, your observations will not be meaningful. Your sketch might be meant to portray mulberry bushes, grape vines, Virginia creeper, or chestnut oak, but without a legend no one will know which species were observed. The sketch could portray a few or hundreds of each plant species, but without a scale explaining how many plants each symbol represents, no one will know how abundant each species is in the area you investigated.
Data collected in the field, greenhouse, or in the lab must be summarized in a format that provides the reader with a quick idea of what the data shows. This is often accomplished by stating general tendencies or trends, for example “the average height of the twenty shrubs was 0.45 meters, ranging from 0.37 to 0.54 meters,” instead of stating the individual heights of twenty shrubs. Your data presentation should also make possible conclusions clear. In this example, since the shrubs grew no taller than 0.54 meters, one might conclude that these shrubs rarely get taller than a half a meter.
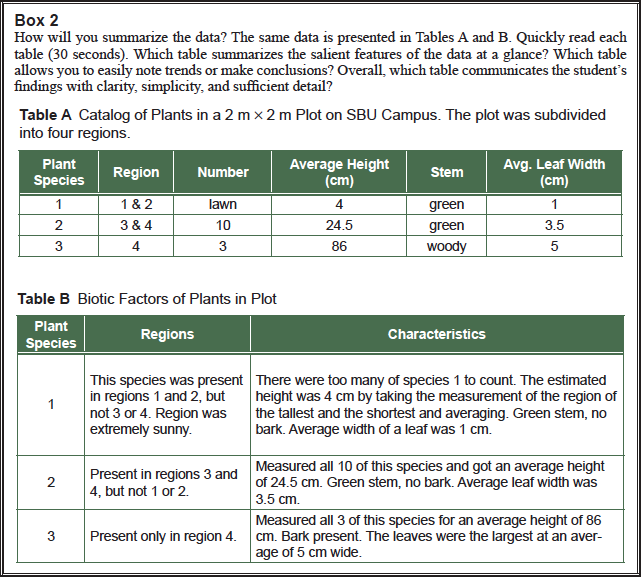
Developing your ability to communicate what you observe is a key skill in learning to work like a scientist in lab. As you collected data, did you think about the type of data you were collecting, and how you would analyze and organize it so its meaning is transparent to others? You not only want to inform others of your findings, but also transfer knowledge to them through communication of your data. A simple example is given in Box 2, and you will have ample opportunity to practice this skill during the remaining labs.
Procedure
- When your team returns to lab from the Greenhouse, sign in your tools and wash your hands.
- Compile your team’s data.
- Organize your combined data as if you were presenting your findings to a peer. You may wish to consider the following when organizing your data:
- Can the audience quickly gain the point of the results from your specific organization of the data? Can you simplify or summarize? See Box 2.
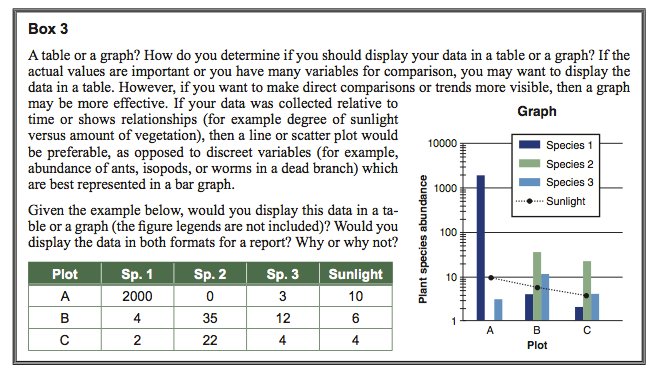
- Have you used the proper format for presenting your data, such as a table, graph, or other type of figure (Box 3)? Are the proper labels and captions in place
- Prepare at least one table or graph (Box 3) using Excel.
1.9 Class Discussion
You will present the following information during a class discussion. All groups should take notes and be prepared to ask questions. For example, you might wish to ask a group if they made specific observations or if they considered other possible scenarios, etc.
- Share your observations and figures/tables you made from your exploration module.
- Share any inferences and conclusions that you made about the plants using supportive evidence.
- Describe some problems with your conclusions.
- Can observations be informative, yet at the same time misleading? What other types of data could you have collected for this lab that would have provided additional support for your conclusions?
- Type up the answers to your exploration module and post to your lab section’s discussion board.
1.10 Greenhouse Plants to Explore