Chapter 1. LAB 3 Biological Data 1: Hypothesizing Evolutionary Relationships
1.1 Introduction
Learning Goals
- Understand the relationships among the diverse living species on Earth and the ways we organize them into distinct categories
- Recognize some reasons why evolution is the basis for our understanding of biology
- Know the mechanisms that drive changes in life’s diversity and some methods we use to discover the links among us
Lab Outline
Activity 2: Demonstrating Phylogenetic Tree Construction
Activity 3: Marine Animal Phylogeny
1.2 Scientific Inquiry
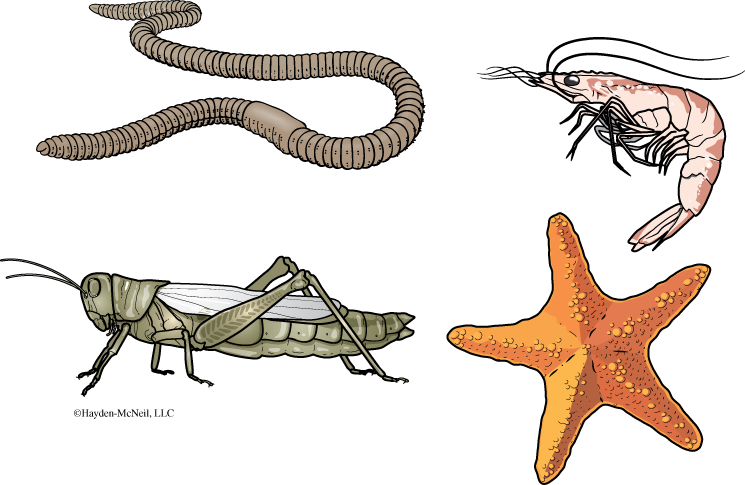
Are humans most closely related to a) earthworms, b) shrimp, c) grasshoppers, or d) sea stars? What knowledge would you use to answer this question? You might use an evolutionary tree of phyla. Why? Understanding evolution aids us in answering such questions because it is the process whereby all biological species descended from an ancestral species; thus evolution is responsible for the commonality of life on Earth.
Evolution is not something that only happened in the past, millions of years ago—it is not something that can only be studied in fossils. Evolution is happening right now. For instance, evolution of color morphology in the peppered moth Biston betularia due to industrial pollution in England is a classic example of contemporary evolution. During the industrial revolution in England in the 1800s, coal soot darkened tree bark and made light-colored B. betularia more susceptible to bird predators. In a relatively short period of time, adaptive color changes occurred increasing the frequency of dark-colored moths in the populations in these areas. Darker moths were less susceptible to bird predators on blackened trees since they were relatively camouflaged.
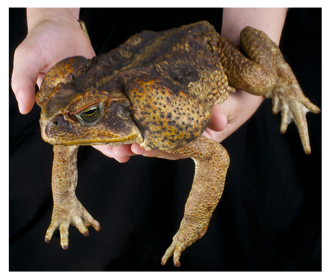
Increased global transport by humans and the introduction of non-native species to new habitats has resulted in undesired consequences around the world. Some newly introduced species that had natural predators or population controls in their native habitat become “invasive” in their new habitat and may undergo further “rapid evolution.” Evolution may occur so quickly that we can witness it during our lifetimes (Alford et al. 2008). A well-studied example is the toxic cane toad, Bufo marinus (Figure 1). This toad was introduced to Australia in 1935 as an ecological way to combat beetles that were destroying sugar cane crops. Pesticides at the time were extremely hazardous to the environment. The toads, though originally from South America, were imported from Hawaii where they had been used successfully to solve the same problem of cane crop infestation. Since this strategy apparently worked well in Hawaii they were exported to Australia to serve as a biological control of the sugar cane beetles there. This assumption turned out to be extremely flawed.
Unfortunately, since its introduction to the northeastern Australian sugar cane fields, the cane toad has been advancing across Australia. In the years prior to 1960 the toad moved approximately 10 km per year. That rate has increased to 40–60 km per year (Team BUFO 2008). Cane toads produce a toxin that is deadly to most predators, including birds, mammals, lizards called goannas, and snakes. There is evidence to suggest that its presence has led to a significant decrease in close to 50 snake species (cited in Phillips and Shine 2004). It has also had an impact on the evolution of particular species of snakes. Large gape size of snakes is correlated with their ability to eat large prey, such as the cane toad. Apparently, there has been a correlative decrease in the gape size for some snakes feeding on cane toads, compared to snakes that are not (Phillips and Shine 2004).
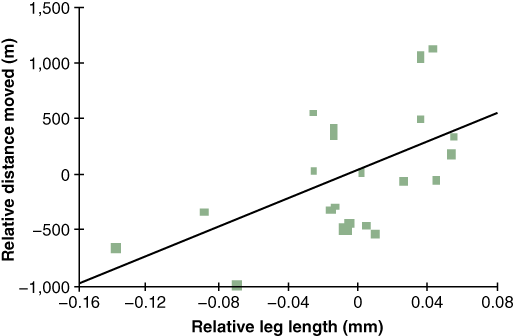
What is responsible for the increasingly rapid movement of this toad across Australia? Phillips et al. (2006) sought to answer this question by suggesting that there is an “evolutionary component” to this increase in invasion rate. Previous studies showed that the distance an anuran traveled correlated with leg length and body size. They hypothesized that the increased mobility might be due to natural selection for longer legs in the cane toad population. Assuming their hypothesis was correct, they expected their data to show three things: 1) toads that arrive first at a new site possess the longest legs, 2) younger toads on average have longer legs than those from older populations, and 3) that the rate of invasion increases over time. To address each of these points, the authors collected toads at different regions along the invasion front and measured their body parts and migration as well as timed their speed. Morphological data for older populations was taken from preserved specimens. Overall their data supported their hypothesis that the relative leg length of the cane toad was increasing and was correlated with the change in rate of migration (Figure 2). How does having an evolutionary component, and not just an ecological component (which has been the main consideration in studies on invasive species), change the way in which one addresses the issue of “invasive species”?
Phillips et al. (2006) conclude their report with the statement, “If there is no fitness disadvantage to individual organisms at the invasion front, evolutionary forces are likely to fine-tune organismal traits in ways that facilitate more rapid expansion of the invading population.” What were the authors implying about leg length in cane toads? Based on your understanding of the evolutionary process, would you expect an evolutionary change, such as longer legs, to also have fitness disadvantages?
Background
If you were to survey all life that presently exists on Earth, you would observe a tremendous amount of diversity—this diversity arose through the process of evolution. Evolutionary principles help us explain the mechanisms that led to the diversity of living things and provide a framework for making meaningful connections among organisms, past and present. The concept of evolution provides a framework for us to build our understanding of the processes that lead to the survival and persistence of living systems. This understanding helps us to solve issues of further biological importance.
For example:
- Why is multi-drug-resistant Staphylococcus so common? Do we understand the consequences of the spread of multi-drug-resistant Staphylococcus bacteria?
- What is the impact of government regulations that require fishermen to take only large fish? Will this affect the mean size of fish in future generations?
- What is the probability that a particular strain of influenza virus will be prevalent in the upcoming flu season?
- Why do certain animals such as the tuna, shark, and dolphin have similar body plans?
- What impact will invasive plant species have on native plant populations?
- Why can we gain valuable insights into human biology from studies on other mammals, worms, plants, fungi, bacteria, and viruses?
Classification of the Diversity of Life
There is tremendous diversity of life on Earth—there are more than 50,000 species of mollusks and 9,000 species of birds, as well as 22,000 plant species in the daisy family alone. Within these groups, life forms vary tremendously in size, shape, physiology, and ecology. How do scientists identify and learn about these organisms? How do they know when different taxa are truly unique species or if they are simply highly variable species?
Scientific investigations on variable life forms reveal “natural groupings” of living things. For example, all mammals possess hair or fur, just as all flowering plants bear flowers and fruit. Systematists use these groups to form natural hierarchies of successively larger and more inclusive taxonomic groupings. The classical terms for these hierarchical groups are species, genus, family, order, phylum/division, kingdom, and domain. This widely adopted system was developed by Carl Linnaeus in the 1700s. Linnaeus based his groupings on shared physical characteristics of organisms, not evolutionary theory which was unknown at that time.
Charles Darwin formulated the Theory of Evolution as an explanation for the diversity of life. Darwin’s important contribution to our understanding of this diversity was that heritable biological characteristics are passed on from one generation to the next and competitive ability determines individual’s survival of selection events—if an individual survives, they may reproduce and leave viable offspring. Therefore, the higher taxonomic groupings are a consequence of similarity based on common ancestry, but the source of diversity is heritable variation in characters that can increase in frequency within a population in successive generations. In some instances, selection on populations can lead to the birth of a new species, as occurs in a speciation event.
According to Ernst Mayr, “a species is an, actually or potentially, interbreeding population that does not interbreed with other such populations when there is opportunity to do so.” For these reasons, biologists focus on groups of species that share a common ancestor, called monophyletic groups. Over the course of Earth’s history, selection and speciation events have generated the diverse life forms we recognize today—the relationship between all living organisms and their ancestors is diagramed as the “Tree of Life” (Figure 3).
The Tree of Life: What Is it?
The Tree of Life represents the ancestral connections linking very early single-celled organisms to multicellular algae, fungi, plants, and animals. Why is this classification important? The profound implication of the structure of this tree is that all of life on Earth as we know it has descended from a common ancestor. This realization enabled biologists to make sense of the huge diversity of life. They noticed that some characteristics are shared among many seemingly unrelated groups, plants and animals for example—in fact, compared to other groups such as the bacteria, we are more closely related to plants than to bacteria. Shared life characteristics make it possible to study processes in plants or bacteria and apply that knowledge to the study of humans.
But what if, in your travels, you find an organism that no one has ever seen before? Could this creature be a totally “new” life form unrelated to the rest of the Tree of Life as we know it? To date, although there are still countless life forms on Earth still to be discovered, every life form that has been discovered has fit into the “tree” somewhere, and that connection makes it possible for us to know, or expect, a great deal about the newfound organism even though it had never been described before.
In this lab, we will study the scientific process used to make phylogenetic inferences that allow us to place new organisms into the Tree of Life based on the characteristics of the organism. A character can be a single feature (e.g., a head) or a character can have a set of alternative states (e.g., color of the eye). Characters used in systematics can be observations based on the study of morphology (external form), anatomy, histology (internal structure), cytology (cellular structure including chromosomes), biochemistry (e.g., variation in protein form and function), and molecular biology (e.g., variation in nucleotide and amino acid sequences) that can evolve from one state to the other.
Once relationships between taxa are hypothesized they are represented as branching diagrams called phylogenetic trees or cladograms, which visually unify and display all available evidence based on heritable evolutionary characters. It was Charles Darwin’s great insight that speciation is due to this divergence or “descent with modification” (evolution) from a common ancestor. Descent with modification is the principle used to make modern phylogenetic trees where ancestors can be linked to derived (modified) species. Scientists discover evolutionary relationships by detecting shared derived characters.
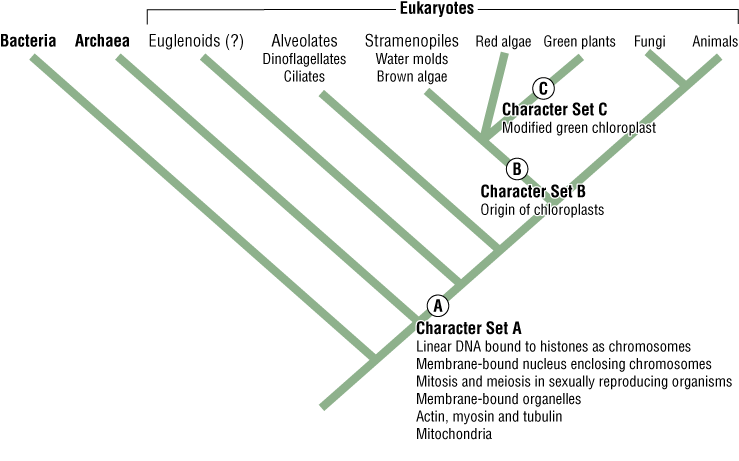
The branch on the Tree of Life (Figure 3) that contains all the living things with chloroplasts is distinct from the branch leading to fungi and animals, but only those living things that contain “green” chloroplasts are called “plants”—hence all plants have the same shared derived character “green chloroplasts.” Although this is a broad example and intuitively simple to grasp, the extension of the approach of using shared derived characters to construct a tree of relationships can become intimidating—in this lab we provide some guiding principles.
Heritability
Although mechanisms of heritability were unknown to Darwin, we now know that all the characters that can be used to construct phylogenies must be heritable. The fundamental process by which characters are inherited by offspring is known as meiosis—this is the process that produces gametes (eggs and sperm) from parental cells. Offspring are produced via fertilization of an egg by a sperm and the resulting cell contains genetic information from both parents. Meiosis is similar in many ways to cell division or mitosis, but mitosis creates new cells and enables growth of an individual, and meiosis produces cells to create the “next generation,” with this generation carrying genetic traits from its parents. It is very important that you understand the fundamental similarities and differences between meiosis and mitosis (refer to your online LIFE textbook).
Interpreting Phylogenetic Trees: How Do You Read the Tree of Life?
Why is it important to know how to read or even construct the Tree of Life or any phylogenetic tree? Phylogenetic trees provide a framework for investigating and conceptualizing the relationships between living things. For example, the relationship between red algae and green plants from the Tree of Life may help you to design an experimental study of a process common to both taxa.
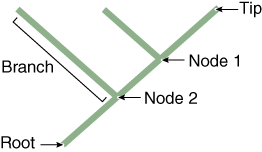
“Shared derived” characters are also called synapomorphies and represent features of taxa grouped on a phylogenetic tree. Notice in the Tree of Life that each branch or clade connects to the rest of the tree by nodes (Figures 3 and 4). Tree nodes represent common ancestors that were points of divergence (where a new group emerges from an ancestral group).
In the Tree of Life (Figure 3), Character Set A represents synapomorphies that unite all the living organisms in the group “Eukaryotes.” How many synapomorphies are listed for eukaryotes on Figure 3 (for example, “linear DNA bound to histones as chromosomes”)? Conversely, ancestral eukaryotes did not have chloroplasts so an ancestor at the node leading to Branch B acquired chloroplasts, which gave rise to that unique clade—what type of organisms represent descendants of this clade? Branch C represents the clade containing all organisms that possess the modified green chloroplast (Character C), the defining synapomorphy of green plants.
Developing Phylogenetic Trees
How do we start to construct a tree? How do we place branches and nodes? In what order do we place each branch and how long should each be? Consider the development of the following tree (Figure 5). This cladogram represents the best supported hypothesis of relationships based on our data.
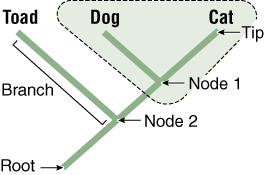
In a cladogram, the tips represent a taxonomic group such as a species, nodes (branch points) represent their ancestors, and the basal ancestor of the entire group is represented as the root of the tree. Taxa at the tips of branches connected by a node are sister taxa (dog and cat). Sister taxa are more closely related to each other than either is to any other group on the tree. A branch connects two nodes, or a node and tip. The root of the tree represents its connection to the rest of the tree of life. A group that includes a node (ancestor) and all its descendents is monophyletic (e.g., hatched triangle; including node 1, dog, and cat). A group that includes a node and some, but not all, of its descendents is non-monophyletic (e.g., a group including node 2, toad, and node 1, dog).
The Principle of Parsimony: The Logical Principle Used in Constructing Cladograms
There is usually more than one way to produce a tree based on synapomorphies. How do biologists know which tree provides the best representation of their data? They take a logical approach to the problem called the Principle of Parsimony, or Occam’s razor (see Box 2). The tree with the least evolutionary change, that includes all of the synapomorphies, is probably the correct one. Einstein, in describing Occam’s razor, said, “The supreme goal of all theories is to make the irreducible basic elements as simple and as few as possible without having to surrender the adequate representation of a single datum of experience.” Said another way, theories should be as simple as possible to include all the data, but no simpler.
Sorting out Characters: Homologous vs. Analogous
When constructing cladograms, we assume that important cladistic characters are similar in different species because they are homologous, i.e., share common ancestry. For example, fur in the dog and fur in the cat are homologous, since similarity of this biological feature is a result of common ancestry, having evolved just once. Homology is any feature or set of features that have the same evolutionary origin, and implies common ancestry (refer to your online LIFE textbook). Anatomical features that have the same evolutionary origin are considered homologous even though they look different (i.e., the mammalian hind limbs) and/or have different functions. This also applies to gene sequences that may be identical in organisms that appear morphologically unrelated.
On the other hand, analogy implies similarity of structure or function without common ancestry. For example, a plant leaf may be similar in shape to a mammal’s earflap (e.g., elephant or basset hound), but these structures do not share a common ancestry. Convergent evolution occurs when unrelated species develop similar structures or genes, often under similar selective regimes—insect and bird wings evolved for flight so their similarity of form and function was believed to be analogous. This perspective has been challenged with evidence that wings in insects and birds share homologous HOX genes.
Box 2 Tracing the Evolution of Characters on a Tree Using the Principle of Parsimony
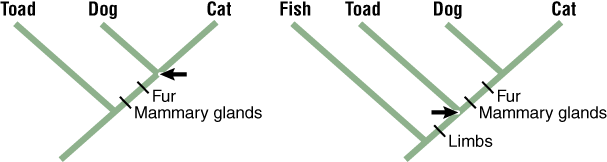
The simplest (most parsimonious) explanation for this distribution of characters is that the dog and cat inherited their shared characters from a common ancestor (arrow). This gives a tree length of 2 (= 2 changes).
The dog, cat, and toad have four limbs, but the fish does not.
The most parsimonious explanation is that the dog, cat, and toad share a common ancestor that had four limbs (arrow). This gives a tree length of 3 (= 3 changes).
It would be less parsimonious to infer that four limbs evolved independently in the toad, dog, and cat. Why?
Resources
1.3 Lab Preparation
Lab Preparation
Watch the vodcast and read this lab. Write all notes in your lab notebook.
Activity 1: Demonstrating Meiosis
Because we reproduce sexually, humans (and most other familiar organisms) are diploid, meaning each cell in the human body contains two sets of chromosomes (2N): one set comes from the mother and one set is received from the father (chromosomes are long, threadlike associations of genes, consisting of DNA and protein). One exception to this 2N rule are the gametes (eggs and sperm). Gametes are haploid (i.e., they contain only a single set of chromosomes—1N). At fertilization, haploid gametes join together (the sperm fuses with the egg membrane) to form a diploid embryo (N + N = 2N). The embryo develops (eventually) into a gamete-producing adult and the cycle begins again. This basic life cycle pattern is found in most sexually reproducing organisms including animals, plants, fungi, and unicellular organisms. The process by which gametes are produced from diploid precursor cells and by which the chromosome number is halved (from 2N to N) is called meiosis. Meiosis contrasts with mitosis, the usual cell division process in which cell number doubles with each mitotic event but the ploidy (number of sets of homologous chromosomes) does not change.
Learning Objectives
After successful completion of this activity, you should be able to:
LO65 Describe the important features of meosis
LO66 Explain how parental alleles are distributed to offspring
LO67 Relate the role meiosis plays in genetic diversity and evolution
Materials
Model chromosomes: knives, forks, and spoons
Colored tape (alleles)
Activity 1 Procedure
- Three volunteers participate in this simulation for the entire class—one acts as the male parent, one as the female parent, and one represents their offspring.
- Each parent receives a set of model diploid chromosomes (2 knives, 2 forks, or 2 spoons); each will have colored tape on them to represent specific genes (alleles).
- Starting with the pair of diploid homologous chromosomes, each parent will simulate meiosis by taking a single chromosome of each pair to represent the chromosomes that will be present in their gametes— the males contribute haploid sperm chromosomes and females contribute haploid egg chromosomes.
- Simulate fertilization of the egg and sperm and combine the haploid gamete chromosomes by giving these model chromosomes to the third member of the team, the “offspring.”
- Repeat the simulation. This represents fertilization of a different egg and sperm and a different offspring with its own genetic identity.
How do the genotypes of multiple offspring compare with their parents’ genotypes?
Activity 2: Demonstrating Phylogenetic Tree Construction
Purpose
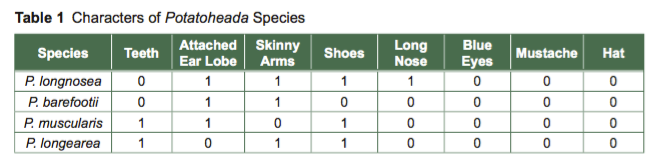
As a class, you will interpret a data matrix of Mr. Potato Head characteristics and construct a phylogenetic tree of different Potato Head models. Below is a summary of information on the characters of four species of the genus Potatoheada (P. longnosea, P. barefootii, P. muscularis, and P. longearea) (Table 1). The matrix (table) contains information on the four taxa (rows) and their characters (columns).
Learning Objectives
After successful completion of this activity, you should be able to:
LO68 Form taxonomic groups using character matrices and hypothesize phylogenetic trees from taxonomic associations
Materials
Poster Tree with moveable branches
Paper strips for transition marks
Activity 2 Procedure
Demonstration 1: Use the four Mr. Potato Head models from the matrix (Table 1) as species. Record your observations and cladograms in your lab notebook as you proceed through this activity.
- Decide which species has the most ancestral characteristics. Which did you choose? ________________
- Place the species you chose at the end of the most basal branch of the tree (Figure 6). Place the remaining species on the tree in order so the most derived species is positioned at the tip of the tree. Ignore color variations.
- Based on the eight characters (Table 1) you used to construct your tree, how many were variable amongst the Potatoheada species? For example, was “Hat” variable?
- Count the number of character changes on this tree (Fig. 6).
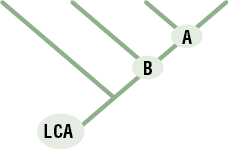
Demonstration 2: Remove the species to begin to create a new tree by repeating the process above and assuming that species P. longnosea shows all ancestral features inherited from the last common ancestor (LCA).
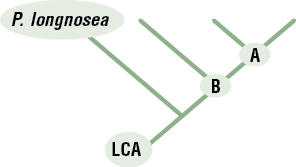
- Place P. longnosea at the end of the most basal branch to visualize the ancestor of the four extant (living) species (Figure 7). (Note: P. longnosea is not the LCA but it represents a species with character states compatible with the hypothetical LCA.)
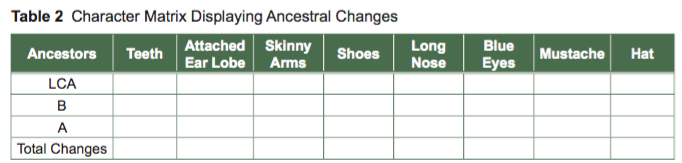
- Write the character states of LCA in Table 2 (assume that LCA has all the characters of P. longnosea in addition to others not included in the matrix).
NOTE: The LCA may not have evolved directly into B, and B may not have evolved directly into A. Why is this statement true?
- Using the cladogram rules, position the other three species, P. barefootii, P. muscularis, and P. longearea, at the ends of the remaining three branches of the tree.
- State which, if any, character(s) changed from LCA to B, noting that the position of B is the ancestor common to P. barefootii, P. muscularis, and P. longearea.
- Enter the character states of B in the matrix (Table 2) by making the appropriate changes in LCA so that it “evolves” into B. For example, if the three species had “hair” on their head, but the LCA was bald, then most likely the common ancestor B had evolved “hair” on its head before the split into the new species. This change would be recorded as a taxonomic character by creating a new column for “Hair” and indicating “Yes” in row B.
- Enter the character states of A in the matrix (Table 2) by making the appropriate changes in the branch from B to A so that B “evolves” into A.
- Mark all evolutionary changes as “tick” marks on your tree using the character matrix (Table 2) to determine which characters changed, and on which branches.
- Calculate the length of the tree (see Box 2). The number of changes on each branch over the branch length is a measure of evolutionary change on that branch. The sum of these changes gives you the tree length, which is a measure of evolutionary change on the tree as a whole.
Discovery of a New Species: You discover a new species of Potatoheada (Table 3) that you describe and name (give it a name). Its character states are listed below. Build the new species and place it next to its closest relative on the bench. Assume that LCA is ancestral to this species as well.

- Add your new species to the tree above. Which species is most closely related to your new species? Explain the rationale for your choice in your lab notebook.
- Mark all changes that occurred in the branch leading to the new species. Is there a difference in the amount of evolutionary change in the two sister species? What does this suggest about the relative rate of evolution in the two species?
Interpreting character evolution: On further study of the genus (you are the leading expert on this taxon), you discover that P. longnosea, P. barefootii, and the new species are insectivores, while P. muscularis and P. longearea are carnivores.
- Where, on the tree, did carnivory evolve? Show this using a tick mark. Remember to include your new species.
- Do you think any of the characters that you studied may have enabled the evolution of carnivory? Which character(s)? Show where each character evolved.
- Briefly describe how this evolutionary change occurred (present an evolutionary scenario), explaining the observations and inferences on which you base this hypothetical scenario. How might you test this evolutionary hypothesis?
Activity 3: Marine Animal Phylogeny
Overview of Animal Evolutionary History
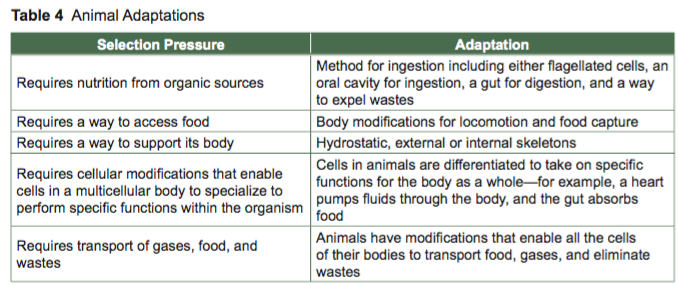
Unlike single-celled organisms that must conduct all life functions within a single cell, animals are mobile, multicellular, heterotrophic consumers—they must have support for their multicellular bodies; they must consume food since they cannot make food like plants can; and they may live in marine, freshwater, or land habitats (see Table 4).
Animals were divided into major clades by their body organization before molecular techniques were developed in recent years. New phylogenetic information derived from molecular genetics has supported much of the tree of life built on morphological data—with some surprising exceptions. For example, the origin of “chordates,” the clade to which we are members, is now a hotly debated controversy because molecular evidence has forced phylogeneticists who use morphology for constructing their trees to reexamine their evidence.
Both molecular and morphological data support the interpretation that the most primitive animals are the “Poriferans,” or sponges. They share similarities with colonial flagellates, and amoeboid cells in sponges can move and change the shape of the sponge body, making them asymmetrical, labile, multicellular aggregations of cells with no true tissue organization. True tissues are present at the next level of animal specialization in the group known as metazoans. The simplest metazoans include “Cnidarians” (hydras, jellyfish, sea anemones, corals), which are more complex than sponges since they are radially symmetrical and are diploblastic, having two distinct tissue layers, an inner endoderm and an outer ectoderm.
The clade possessing further specialization is the bilaterally symmetrical, triploblastic clade known as the Bilateria. Triploblastic animals possess three primary cell layers; in addition to the ectoderm and endoderm, bilaterians also have an intermediate cell layer called the mesoderm. The ectoderm as the exterior cell layer specializes into tissues that make skin and hair or fur, and its cells can also specialize into nervous tissue. The endoderm specializes to make the gut and various tissues and organs essential for digestion. The mesoderm gives rise to muscle and bone, and organs such as the kidneys.
The Bilateria are split into two major groups, the protostomes and deuterostomes. Bryozoans, earthworms, mollusks (clams, snails, chitons, octopus, and squid), roundworms, and arthropods (spiders, ticks, horseshoe crabs, insects, millipedes, centipedes, shrimp, crabs) are all protostomes. Chordates (animals with backbones) and echinoderms (sea stars, sea cucumbers, sea urchins) are deuterostomes.
Learning Objectives
After successful completion of this activity, you should be able to:
LO70 Identify and describe synapomorphies between various organisms
LO71 Create and interpret a character matrix
LO72 Create a phylogenetic tree based on observations
LO73 Apply the principle of parsimony
Materials
Dissecting kit
Dissecting scope
Animal specimens from animal taxa, potentially including Porifera, Cnidaria, Nematoda, Annelida,
Arthropoda, Mollusca, Echinodermata, and Chordata
Saltwater tank containing marine organisms
Culture dishes to contain marine organisms
Nets and tongs for removing animals from the tank without contaminating the main saltwater tank
Activity 3 Procedure
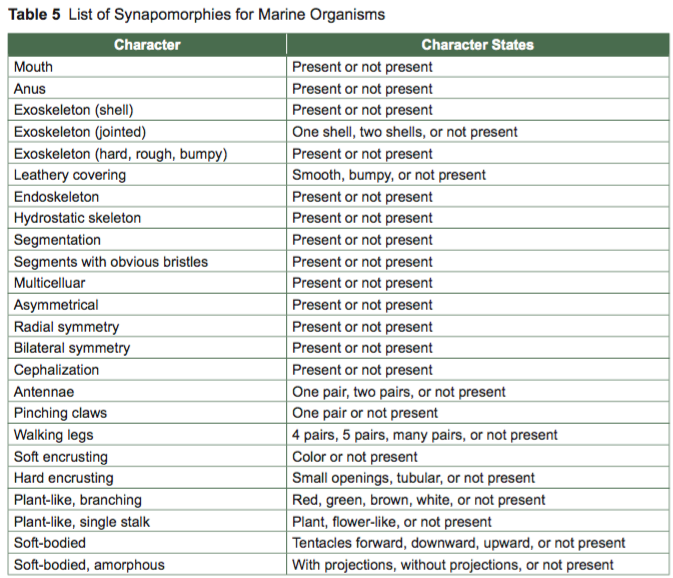
- Choose five synapomorphies from the list provided in Table 5. This is just a suggested list; feel free to use other synapomorphies that you observe.
- Obtain five specimens of marine animals from the saltwater tank.
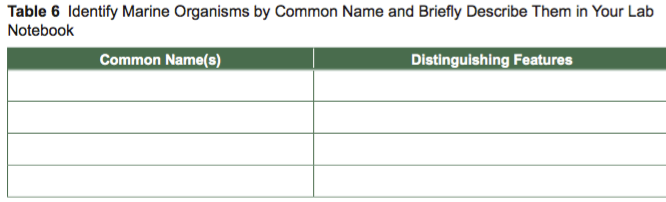
- Using the dissecting scope, make observations of specimens from the saltwater tank in a table similar to Table 6, in which you identify the common name and distinguishing features of the marine animals you selected.
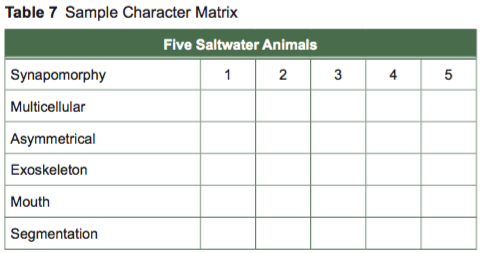
- Using your table and selected synapomorphies, create a character matrix similar to Table 7.
- Code for the absence of a trait with (0) or for its presence with (1) and fill in the character matrix based on your observations of the representative animal from each group.
- Create all possible phylogenetic trees for the selected synapomorphies. Place a mark at each trait on your tree at the position where you think that trait evolved.
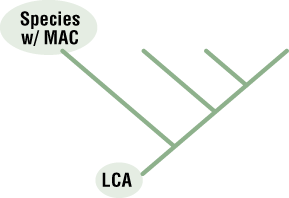
- Decide which species has the most ancestral characteristics (MAC). The MAC shows all ancestral features inherited from the last common ancestor (LCA).
- Place the species you chose at the end of the most basal branch of the tree (Figure 8). Place the remaining species on the tree in order so the most derived species is positioned at the tip of the tree.
- Count the number of character changes on this tree.
- Use the principle of parsimony to select your phylogenetic tree. Calculate the length of the tree (see Box 1 and 2). The number of changes on each branch over the branch length is a measure of evolutionary change on that branch. The sum of these changes gives you the tree length, which is a measure of evolutionary change on the tree as a whole.
- Present your groupʼs character matrix and hypothesized phylogenetic tree to the class for discussion.