Chapter 1. LAB 9 Introduction to Experimental Design 3: Isopod Experiments
Introduction
Learning Goals
- Understand and apply the elements of good experimental design
- Understand the differences between positive and negative controls and null and alternate hypotheses
- Learn how to collect data for testing hypotheses
- Learn how to use statistical analyses to determine if results are significant
- Learn how to organize and analyze data for written communication
- Know the sections of a lab report and how they relate to the format of primary literature
Lab Outline
Activity 1: Designing an Isopod Behavior Experiment (Pre-Lab)
Activity 2: Testing Your Own Hypothesis
Activity 3: Communicating Experimental Findings
1.1 Scientific Inquiry
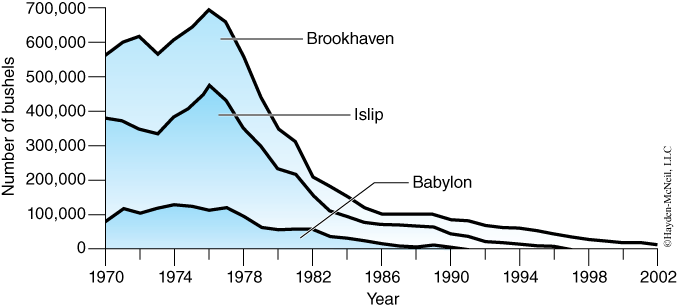
- Why have there been dramatic declines in shell fishery harvests on Long Island (Figure 1)?
- Is there a correlation between shellfish harvest size and overall marine habitat quality?
- How can we restore our ocean resources to the healthy and diverse marine ecosystems they once were?
For a long time, marine resources have been taken for granted and exploited without regard to the consequences of over-fishing and habitat destruction. In the last 25 years, there have been precipitous changes in our marine ecosystems and these changes are reflected in the abundance of our once vital fisheries. How do we distinguish between the changes in animal populations that humans can control vs. changes that are part of “natural cycles” that are not under our control?
Scientists are asked to investigate a huge range of biological issues, including ecosystem diversity, health and disease, and food production, and they seek to develop innovative products and services to address these issues. What are some basic approaches to scientific investigation? How are experiments designed? How are the data produced by these investigations used to draw cause and effect conclusions as well as solutions to our problems?
Science in Action
Conover and Munch, two professors from Stony Brook’s School of Marine and Atmospheric Sciences (SoMAS), contributed answers to these important questions. It is well known that over-fished species have a reduced number of older and larger individuals. It was thought that if only larger fish were taken and smaller individuals and juveniles were spared, the population would remain relatively undisturbed or rebound easily. Therefore, local, state, and federal governments imposed fishing regulations that restricted the minimum size of many game fish. To test this assumption, Conover and Munch (2002) compared three populations of fish in which 1) only large individuals were removed, 2) only small individuals were removed, and 3) individuals were removed at random.
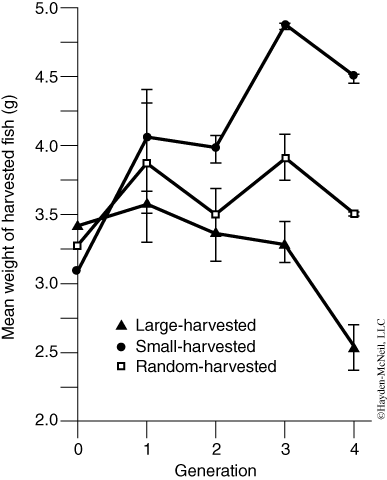
After four generations of this type of selection pressure, an interesting trend emerged—“the mean weight of the harvested individuals from the small-harvested lines was larger than that of the large-harvested lines.” In the small-harvested populations, the individuals who grew fastest as juveniles were more likely to survive, whereas in the large-harvested group, individuals that grew most slowly were more likely to survive (Figure 2). Hence, by Generation 4, the mean individual weight at spawning was 1.05 g for the large-selected line and 6.47 g for the small-selected line. Does this mean our policies should require us to take only small fish? What happens if we deplete the juveniles who have not yet reproduced?
The authors suggest that effective management plans must consider evolutionary consequences of fishing regulations to preserve natural genetic variation and healthy ecosystem dynamics. “No take zones” and maximum size restrictions (all captured fish must be below a certain size) are two forms of management that might preserve genetic variation in fish so that over-fished populations have the potential to rebound and recover.
1.2 Background
What is a good experimental design? Would you know a good design if you saw one? How would you design a biological experiment? Imagine that you are conducting a clinical trial. In your group of patients, each shows three symptoms: pain, high levels of calcium in the blood, and myeloma (a type of white blood cell cancer). You prescribe a new drug called Zoledronic Acid to all of the patients. Immediately, all of them feel better. Pain is reduced. Calcium levels return to normal. And none of your patients die from cancer! This is great, right? Have you found a possible cure for cancer? How can you be certain?

The Placebo Effect: The placebo effect is the improvement of a patient from simply the administration of a substance rather than the effect of the substance itself. Recent evidence suggests that the placebo effect may be restricted to only “subjective” clinical responses such as pain.
You probably have guessed that the sample clinical trial given above has a poor experimental design. There is no control. In order to draw conclusions from your clinical trial, you must have at least two groups. One is the control group and the other is the experimental group. The control group should receive exactly the same treatment as the experimental group except for the variable that you are testing. In this scenario, you might have divided your patients into two groups, each with exactly the same symptoms. The experimental group would receive the new drug Zoledronic Acid, while the control group would receive a placebo. A placebo is an inactive treatment, such as a sugar pill or an inert drug. You would expect that the group of patients that received the placebo would show no improvement since sugar is not a cure for cancer.
An experiment that you conduct that has a “known” outcome is called a “control.” For example, printing a test page on your newly installed printer is an example of a positive control. A positive control is used to verify or repeat a known effect (the printing of a test page) to make sure that your procedure (or printer driver) is working properly. The alternative is a negative control. This would be an experiment in which a negative result is expected. In the clinical trial example, the group of patients that received the placebo would be the negative control group. If your negative control group (that received the placebo) shows a reduction in pain, a return to normal calcium levels, and no cancer, then you know that these effects are not the result of Zoledronic Acid (the variable in the experimental group) and must be attributed to some other factor.
Setting up good controls is only part of good experimental design. Scientists try to get the most information or data from the least number of experiments (as you may do when shopping—you try to get the most for your money). The experiments that are conducted in biology can be quite costly and many utilize cells, tissues, plants, animals, or humans. To conduct poorly planned experiments is not only wasteful, but unethical. Therefore, scientists often spend weeks or months planning a series of experiments that will take only a couple of minutes or hours to run. Well-planned experiments are part of good scientific practice and are more likely to yield high quality data.
So, where should we begin? Start by asking a series of questions, many of which you commonly asked as a child when you first explored your environment:
These questions lead to hypotheses which are directly tested by further observations and/or experiments. A hypothesis is a falsifiable statement based on your observations, or data. For example, this hypothesis is a falsifiable statement: “Zoledronic Acid reduces the level of calcium in plasma.” A strong hypothesis test (i.e., an experiment) is one that could “disprove” or “falsify” your hypothesis. In our example, we can test our hypothesis by orally administering Zoledronic Acid to different patients, drawing blood, and measuring the amount of calcium in the plasma. If calcium levels decrease, then the hypothesis is “supported” but NEVER PROVEN. If calcium levels increase in plasma, then the hypothesis is “falsified” by the data.
An example of a statement that is not falsifiable would be, “Zoledronic Acid causes plants to become unhappy.” How do we know when plants are happiest? What does it mean for a plant to be “happy”? We do not know what plants enjoy doing and therefore this statement is not falsifiable.
Scientific experiments are designed by setting up circumstances that challenge the hypothesis. Your design should predict the kinds of results that would support your hypothesis, and your experiment should be designed to be completed under time and resource constraints. If the results of your experiment do not coincide with the predictions of your hypothesis, then it is unsupported or falsified and you must search for another explanation of the phenomenon under investigation.
In experiments where cause and effect are implied, we often make use of an experimental design that contrasts the null hypothesis (H0) with an alternate hypothesis (H1). In our clinical trial above, the null hypothesis would be that “Zoledronic Acid has no effect on patient health.” The null hypothesis implies that there is no cause and effect relationship between the treatment and the results. If you conducted a clinical trial and found that your experimental group and your control (placebo) group showed no difference from each other, this would support the null hypothesis.
The alternate hypothesis implies that there is a relationship between the treatment and the results. An alternate hypothesis is that “Zoledronic Acid reduces calcium levels in the blood.” Often, there are many alternate hypotheses that can be proposed when trying to connect “cause” to “effect.” You can compare a null and an alternate hypothesis by using probability. Probability is the likelihood of something occurring. You can think of the null hypothesis in terms of probability as “an outcome based on random chance.” In other words, the null hypothesis states that there is an equal probability that a patient in the experimental group will have the same outcome as a patient in the control group. Similarly, the alternate hypothesis states that the experimental group always shows improvement, and the control group never does.
This brings us to the two simplest outcomes: either all of your experimental results (data) match the null hypothesis OR all of your data match the alternate hypothesis. In reality, the data almost never match perfectly with either. Because of this, scientists must determine whether the data are due to random chance or due to the treatment that was being tested (e.g., Zoledronic Acid). Scientists use statistical tests to make the distinction between chance and treatment effects.
Statistical tests are based upon probabilities. If there is a high probability that the data are due to chance alone, we cannot conclude that the experimental treatment had any discernible effect. If, however, there is low probability that the data are due to chance alone, then we can conclude that the experimental treatment likely had an effect. We can never completely eliminate chance as the cause of a given result; however, we can say that the probability of it occurring by chance is very low. The probability, or P value, reported in statistical tests is the probability (likelihood) of a result occurring by chance. But at what probability, or P value, would you conclude that your alternate hypothesis is supported, or that your data is the result of the treatment rather than chance alone?
At What P Value Would a Scientist Reject the Null Hypothesis?
As a general rule, scientists use a probability value of 5% (P = 0.05) as the cut-off between chance and treatment effects. If the probability of a result happening by chance is less than 5% (P < 0.05), scientists conclude that the treatment under study had a significant effect. If, however, the probability of obtaining a result due to chance is greater than 5% (P > 0.05), we cannot distinguish chance from treatment effects and we must conclude that treatment effects were not significant.
By the end of BIO 205 or BIO 207, you will be expected to design an experiment, collect and properly analyze data, and visually display data in the form of a scientific figure (tables, graphs, etc.). You will collect both qualitative and quantitative data, and you will analyze these data using descriptive (summary statistics and histogram), parametric (regression analysis), and non-parametric statistics (chi-square).
1.3 Resources
Conover DO and Munch SB. 2002. Sustaining fisheries yields over evolutionary time scales. Science 297: 94–96.
Harris M, Taylor G, Taylor J. 2008. Math and Statistics for the Life Sciences. New York: W. H. Freeman. 187 p.
1.4 Activity 1: Designing an Isopod Behavior Experiment (Pre-Lab)
Purpose
Although there are many critical elements to a good experimental design, one key element when working with live organisms is knowing as much as possible about the organism (whether plant or animal) under study, especially as it relates to the topic of interest. For example, if you want to use isopods as biosensors of chemicals or metals in the environment, you may want to treat them with and without that chemical or metal and see if there are variables you can measure that show a significant and consistent effect. Without this information you would waste valuable time (and money) using an organism to study environmental toxicology that is not suitable for the research.
What do you know about isopod physiology and anatomy, ecological niche, and behavior that allows you to develop a testable hypothesis? You should read the literature on terrestrial isopods and consider some questions that you might want to research. Ask your instructor for help with databases or journals to search. Following are some sample questions you may want to answer before you pose a hypothesis and an experimental design to test it:
- Is light or heat or both influencing isopod behavior in the wet versus dry experiment? Is there a way to separate out these two variables in an experimental design?
- Are sponges a good replacement for normal isopod burrowing places or would some other natural material work better, like tree bark or leaves? How easy will it be to collect data using alternate microsites?
- What chemicals do Long Island isopods come in contact with in their natural environments, e.g., what is the chemical makeup of detritus? Are they attracted to some chemicals and avoid others?
- Does the type of moisture used in an isopod experiment matter? Would rainwater or detritus-treated water serve as more natural alternatives for a wet versus dry test?
- Does the level of moisture or humidity matter for an isopod? Can it be too wet?
- What happens if you assay the behavior of one isopod at a time in the arena? Do they tend to traverse the same general pattern or is the pattern random? Should you test each isopod individually instead of as a group, i.e., do they influence each others’ behavior?
- Can isopods differentiate scents, such as scents from fruit commonly found rotting on the forest floors?
You have already had an opportunity to work with isopods and learn firsthand how they behave in the arena designed for lab. You will now have an opportunity to test your own hypothesis, either using the present experimental design or making modifications using your own materials. Plan a possible experiment prior to lab by completing the following steps on your section discussion board.
1.5 Learning Objectives
After successful completion of this activity, you should be able to:
LO51 Diagram an approach to researching information about a topic under study
LO52 Locate a primary literature article and book resource on isopods
LO53 Produce a plan for a basic categorical experiment with at least two categories and a control
Activity 1 Procedure
- Review the literature and preliminary experimental results. Review the isopod habitat preference experiment, “time to choice” experiment, and “distance traveled” experiment and your results from the statistics lab. Search the literature for background information on isopods.
- Define your variables. Be creative and choose experimental variables of your own. If you choose a variable that requires reagents not provided in lab (see materials for Activity 2), remember to bring that substance or object with you to lab. Please do not bring substances that are dangerous (to humans and isopods) or illegal to lab.
- Define your hypothesis. Based on your knowledge of isopods, describe how your variables are likely to affect isopod preferences. State the assumptions you have made while defining your hypothesis.
- Describe your experimental design. How many isopods are needed for your experiment? Will you need negative and positive controls and what will your control(s) be? How many times will you repeat your experiment? For each repetition, will you use the same or a different sample isopod population? Can your data be compared to data from the wet and dry experiment, “time to choice” experiment, or “distance traveled” experiment? How will you set up your isopod arena or choice tube chamber? Will you need to modify your isopod arena setup, such as remove the lamp? If you choose to test the speed at which a single isopod makes a choice, what controls could you use? How many replicates should you use? Should you test the same isopod multiple times? Should you test different sample populations of isopods?
- Predict the outcome of your experiment. Use your hypothesis and experimental design to predict the outcome of your experiment.
- Plan your data collection process. What time intervals will you use? If you use a time greater than 5 minutes in the presence of light, do you run the risk of compromising the fitness of the isopods? How will data be collected and recorded? Will you measure other variables, like temperature, pH, etc.? Will you collect any timed data?
- Produce a procedural flowchart or stepwise protocol. What will you set up first? What initial data do you need to collect, e.g., temperature of the sponges? In what order will you conduct each part of the experiment? A step-by-step procedure will aid you in the successful and proper completion of your experiment. You may have to modify it once you begin your experiment.
- Determine how you will analyze your results. How will you organize your data to show trends? What type of table, figure, or graph will visually display the trends in your data well? What type of statistical analysis will be performed on your data?
1.6 Activity 2: Test Your Own Hypothesis
Learning Objectives
After successful completion of this activity, you should be able to
LO54 Set up an isopod behavior experimental design
LO55 Perform an experiment on isopod preference and collect data
LO56 Perform appropriate statistics on categorical or continuous data
Materials
Isopod choice tube chamber and delivery apparatus
85W flood light on ring stand
8 sponges
Isopods
Solutions (Room temperature RO water, 10% ethanol, 10% NaCl, 10% sucrose, and warm RO water)
Transfer pipettes
Light meter (or use app)
Vernier caliper
Permanent marker
Ruler
Thermometer, pH meter, and balance
Ice and incubator (set to 37 °C) for warm water
(Add to this list materials you will bring from home for your group’s experiment.)
Activity 2 Procedure
- Finalize your experimental design, procedure, data collection, and analysis with your group members.
- Collect all data in your Excel spreadsheet.
- Post your group’s experimental design notes and data to the discussion board.
Sudden changes in temperature may cause non-Pyrex glass to shatter. Protect yourself from this danger by wearing goggles! If you use a high temperature bulb, such as an incandescent bulb, you MUST wear goggles when the bulb is on.
1.7 Activity 3: Communicating Experimental Findings
Learning Objectives
After successful completion of this activity, you should be able to:
LO57 Organize your experimental data in a way that allows you to search for patterns or trends
LO58 Write a figure legend that is descriptive of a figure or table
LO59 Designate where specific information belongs in each section of a lab report
LO60 Construct figures containing appropriate information for the results section of a lab report
Materials
Isopod experiment data in an Excel spreadsheet (student)
Observations from isopod experiment (student)
Statistics flowchart from lab notebook (student)
Knisely text (in lab) and statistics primer (posted on Blackboard)
Lab report rubric (student obtains from Blackboard)
Laptop with Excel (bring if it is possible since there are only two computers in lab per group)
Activity 3 Procedure
- Every group member should work at a computer to complete this activity individually, but first discuss your data as a group.
- List all the data that could be included in your lab report, such as the group and class data from the “wet versus dry” experiment (Lab 6, Activity 1) and the group and class continuous data from the Activity 2 experiment. You might have additional observations or data, for example, total mass of all isopods at the beginning and end of your experiment, temperature over time, and number of isopods “not under a leaf” over time.
- If you collected replicate data, you can use descriptive statistics to describe means, standard error, or other useful values. Your descriptions should be relevant to your data interpretations so a reader can follow your evidence and lines of reasoning.
- To compare the number of isopods in each experimental category, convert your data to either ratios or percentages. For example, if you tested the effect of four different chemicals (A–D) on 24 isopods, you might have discovered that 0, 18, 4, and 2 traveled to sponges with chemicals A, B, C, and D, respectively. What would the ratio or percentages be for this distribution? Why is it better to use percentages in this case rather than ratios or raw values, especially if you are doing replicates or making comparisons with data from other groups? If you tested “distance traveled” with scented graph paper in environment 1 and a different scent in environment 2, how would you analyze the data? Would you do a correlation? A t-test? How would you explain this outcome in the results section of your lab report? How does reorganization of your data help you think scientifically about the behavior of the isopods?
- Discuss the following questions with your group members and record the answers:
- For which data, if any, is it critical to know exact values? Should we tabulate that data? How should the tables be set up? Can this data be described in written form and still be just as understandable for a reader?
- Should percentage data be presented in graphical form? What can a reader gain from the graph that might not be obvious from written text or from a table? What type of graph is appropriate?
- Analyze your isopod distribution data, isopod “time to choice” data, or isopod “distance traveled” data using the proper statistical test (see statistics flowchart). If you collected continuous data, can you apply any statistical analysis to that data? For example, if you recorded the size of isopods for each isopod you tested in the “time to choice” assay, would a correlation analysis make sense for your particular study?
- Discuss figure preparation as a class by critiquing sample figures provided by your instructor. Use the Knisely text as your guide.
- Use the report rubric that you brought with you to lab to write out each section of the lab report in your lab notebook with several blank lines in between each for writing. Using the “Format and Content of Scientific Articles” from Lab 1 as a guide, write out the answers to each of the questions in bulleted format under each header in your lab notebook. Although you should write out these answers in your own words, feel free to discuss the questions with your groups members.
- If there is time, complete your data organization, analysis, tabulation, and graphing individually.
- Turn in your lab notebook copy to your instructor. Email your graphs or data analysis to your instructor, but do not post on the discussion board since this is to be used for your individual lab report.