FIGURE 9
.9
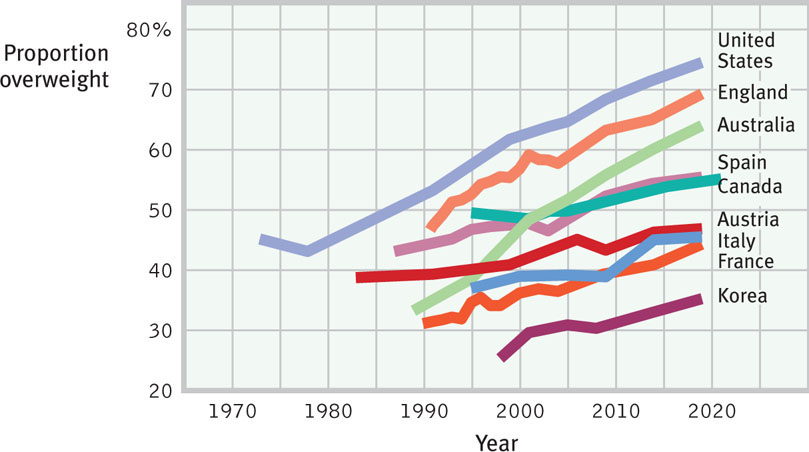
Past and projected overweight rates, by the Organisation for Economic Cooperation and Development
[
Leave
] [
Close
]
Next