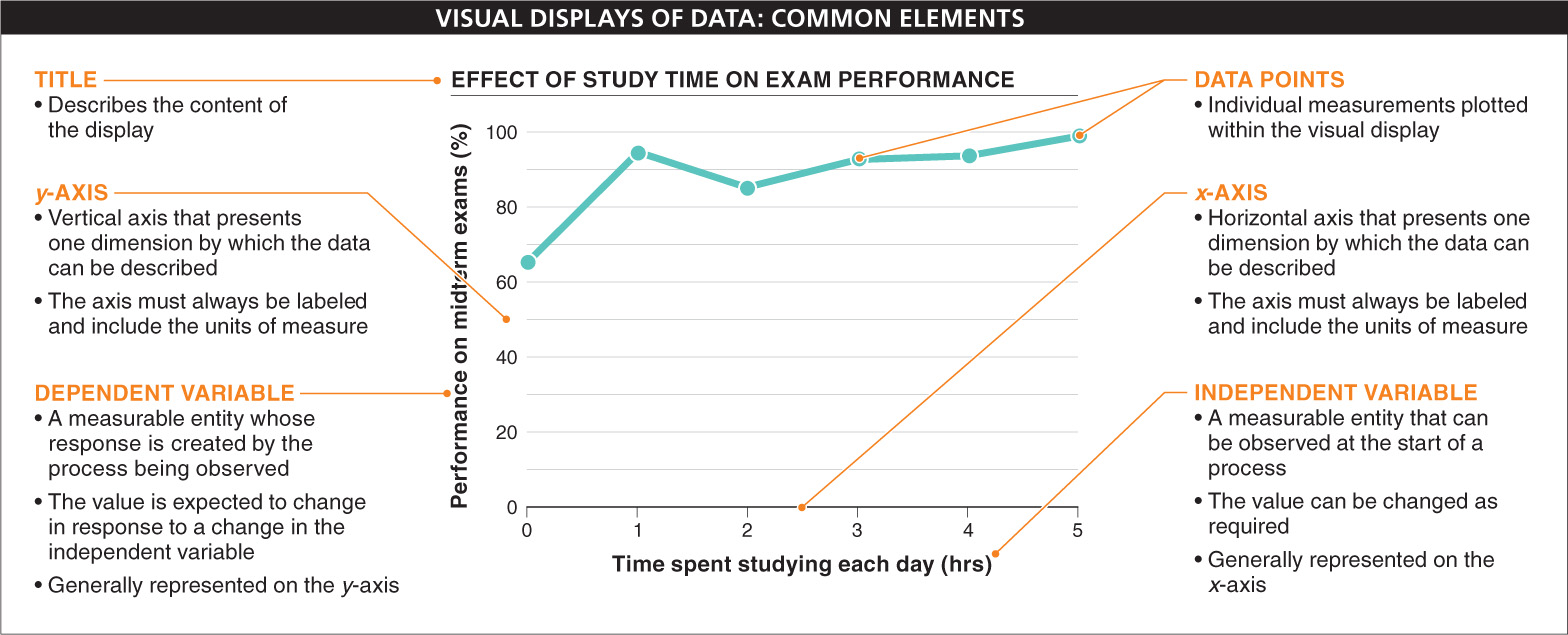
FIGURE 1-19
Common elements of effective graphical presentations of data.
Shown here: an example of a line graph.