Biologists have learned some important lessons from insurance agents. Because insurance companies need to estimate how long an individual is likely to live, they invented something called the life table (FIGURE 14-16). It ought to be called a death table, though, because the table tallies the number of people in a population within a certain age group, say 10–
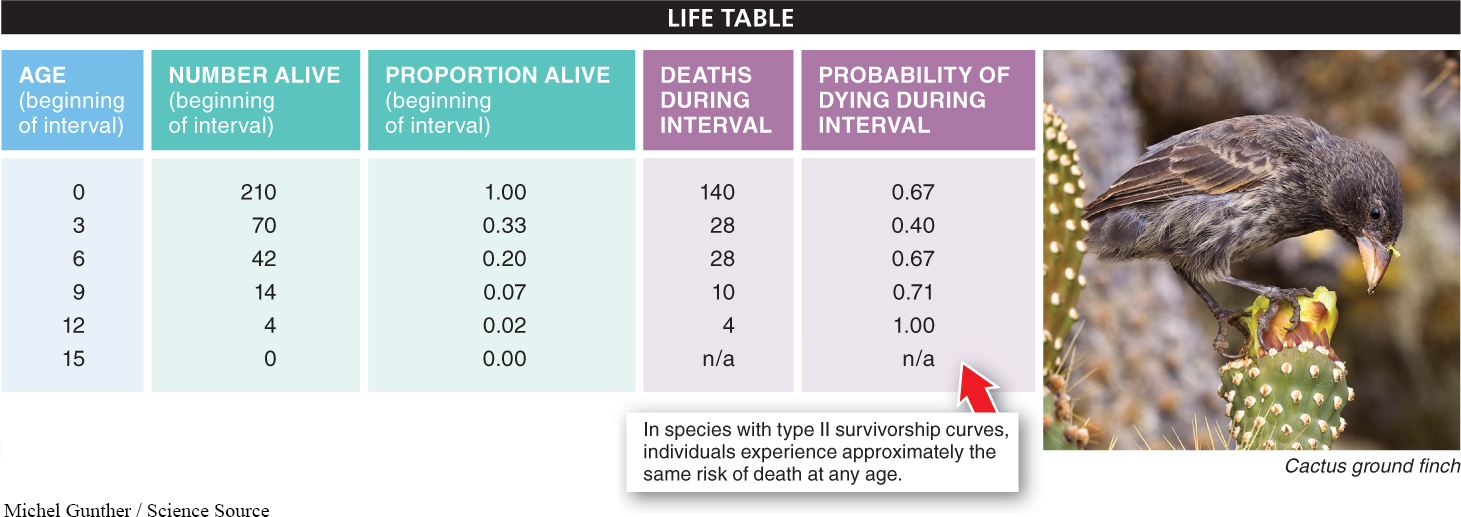
From life tables, biologists create survivorship curves, graphs showing the proportion of individuals of a particular age that are now alive in a population. Survivorship curves indicate an individual’s likelihood of surviving through a particular age interval. And they reveal a huge amount of information about a population, such as whether most offspring die shortly after birth—
Three distinct types of survivorship curves are shown in FIGURE 14-17. The curves plot the proportion of individuals surviving at each age, across the entire range of ages seen for that species.
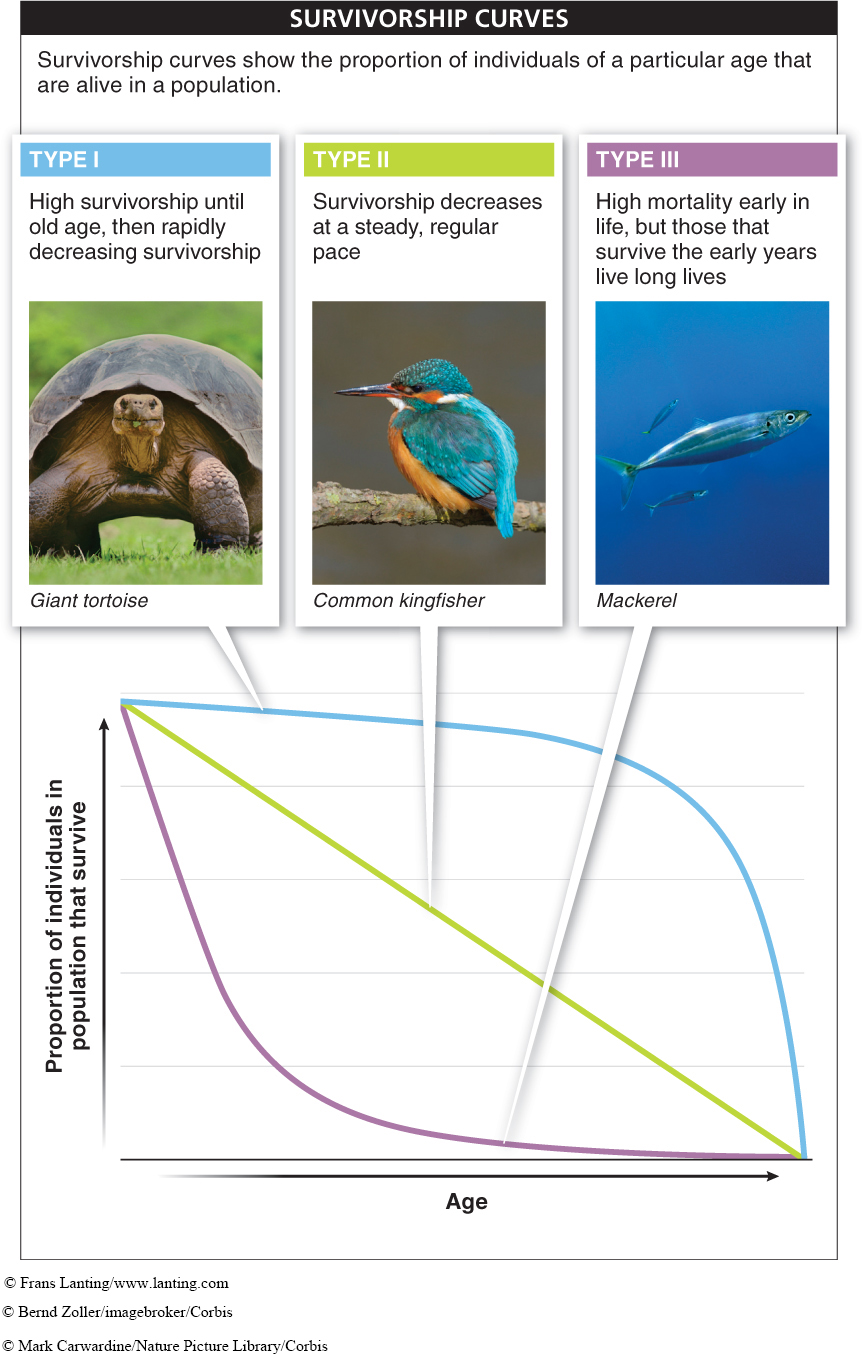
Type I. At the top of Figure 14-17, in blue, is the survivorship curve seen in most human populations, and shared by the giant tortoise. We and the tortoise have a very high probability of surviving every age interval until old age, then the risk of dying increases dramatically. Species with a type I survivorship curve, which includes most large mammals, usually have a few features in common. They have few natural predators, so they are likely to live long lives. They tend to produce only a few offspring—
Type II. In the middle of the figure, in green, is a survivorship curve seen in many bird species, such as the common kingfisher, and in small mammals such as squirrels. The straight line indicates that the proportion alive in each age interval drops at a steady, regular pace. In other words, with a type II survivorship curve, the likelihood of dying in any age interval is the same, whether the bird is between 1 and 2 years old, or between 10 and 11.
Type III. At the bottom, in purple, is a survivorship curve in which most of the deaths occur in the youngest age groups. Common in most plant and insect species, as well as in many marine species such as oysters and fish, the type III curve describes populations in which the few individuals lucky enough to survive the first few age intervals are likely to live a much longer time. Species with this type of survivorship curve tend to produce very large numbers of offspring, because most will not survive. They also tend not to provide much parental care, if any. A classic example is the mackerel. One female might produce a million eggs! Obviously, most of these (on average, 999,998) do not survive to adulthood, or the planet would be overrun with mackerel.
588
In reality, most species don’t have survivorship curves that are definitively type I, II, or III: they may be anywhere in between. These three types, though, represent the extremes and help us make predictions about reproductive rates and parental investment without extensive observations of individual behavior. Survivorship curves can also change over time or location. Humans in developing countries, for example, tend to have higher mortality rates in all age intervals—
TAKE-HOME MESSAGE 14.10
Life tables and survivorship curves summarize the survival and reproduction patterns of the individuals in a population. Species vary greatly in these patterns: the highest risk of mortality may occur among the oldest individuals or among juveniles, or mortality may strike evenly at all ages.
How is a survivorship curve for a giant tortoise different from that of a mackerel?
A giant tortoise has high survivorship throughout most of its life, which rapidly decreases late in life. The mackerel has high mortality early in life, but those that survive the early years live long lives. These survivorship curves are type I and type III, respectively.
589