Chapter 13. Chapter 13 Graphic Content
Introduction
Graphic Content
true
true
You must read each slide, and complete the question on the slide, before proceeding to the next one.

Instructions
Review the information provided in the graph to answer each question below.
After submitting your answer, you will be provided feedback to check if your response is correct.
(This activity contains 6 questions.)
Question 13.1
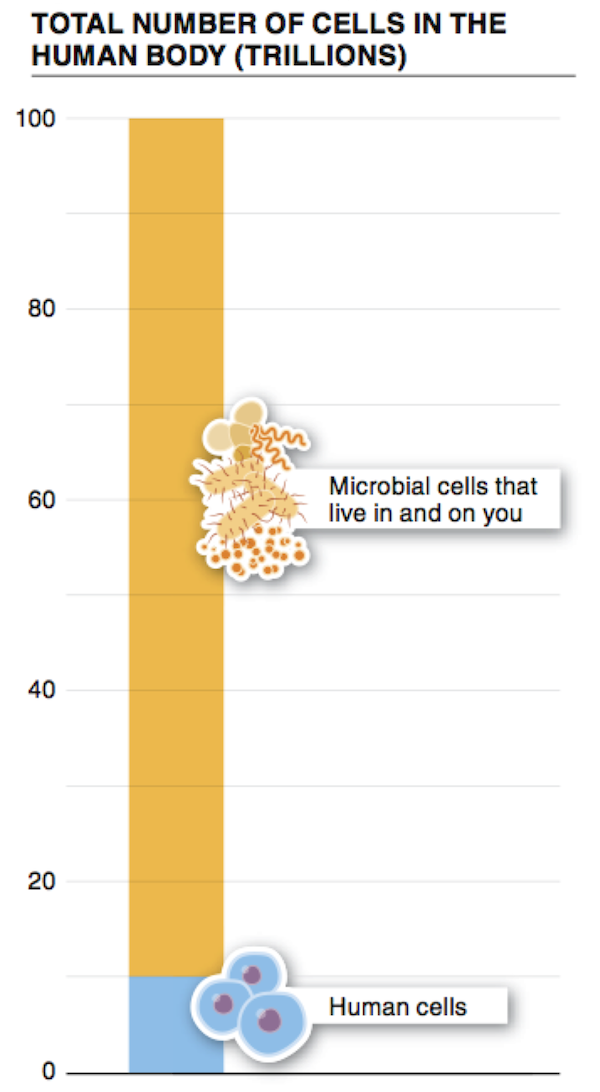
Although it may be surprising, the vast majority of cells in a human body are microbial cells—probably bacterial—rather than human cells. In fact, according to this figure, 90 percent of the 100 trillion cells in a human, or 90 trillion cells, are microbial.
Question 13.2
A human has about 10 trillion human cells.
Question 13.3
A human has about 90 trillion microbial cells.
Question 13.4
One feature of bacteria that contributes to their ability to outnumber human cells even as a human still appears human is that bacterial cells are significantly smaller than eukaryotic cells.
Question 13.5
It is not clear how the cell counts were obtained. The figure would be much more helpful if it included information on how the data were collected. For example, if the cell counts for multiple humans were determined, how much variation was there among individuals, both in the total number of cells and in the proportion of each type?
Question 13.6
There are several other ways to convey these data. Here are two examples. First, because the data include two components (number of bacterial cells and number of human cells) that make up one entity (a human), you could present them as a pie chart, with 90% of the pie in one color, representing bacteria, and 10% of the pie in another color, representing human cells. A strength of this presentation is that it conveys nicely that most of the “pie” is bacterial rather than human. A weakness is that it conveys information on how each component represents some proportion of the whole, but no information on the absolute numbers of each cell type. Second, because there is a comparison of two entities, you could present side-by-side bar graphs, with a y-axis labeled “Number of cells (trillions).” The bar for “human cells” would extend to 10 trillion, and the bar for “bacterial cells” would extend to 90 trillion. One strength of this approach is that it makes it easier to compare the two numbers. A weakness is that it de-emphasizes that the two components together make up the whole of how many cells there are in a human body.
Activity results are being submitted...