
Chapter 23. Chapter 23 Graphic Content
Introduction
Graphic Content
true
true
You must read each slide, and complete the question on the slide, before proceeding to the next one.
Instructions
Review the information provided in the graph to answer each question below.
After submitting your answer, you will be provided feedback to check if your response is correct.
(This activity contains 7 questions.)
1.
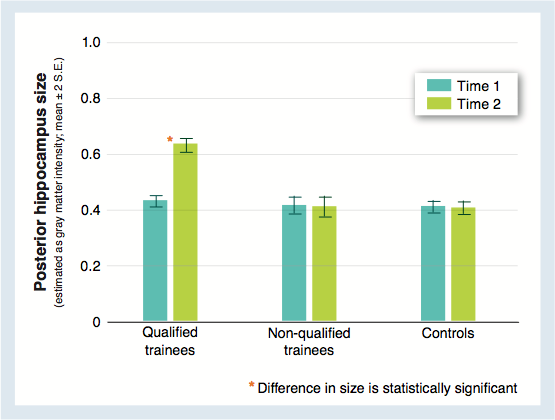
1. What is the take-home message of this graph?
The graph shows that qualified taxi drivers have an increased posterior hippocampus size relative to nonqualified drivers and non-drivers.
Activity results are being submitted...