Many human traditions have a sacred “Tree of Life.” The bodhi tree that the Buddha sat beneath to achieve the ultimate truth is the Tree of Enlightenment; the apple tree in the Garden of Eden is the Tree of Knowledge. The history of the relationship between all organisms that constitute life on earth is another tree of life.
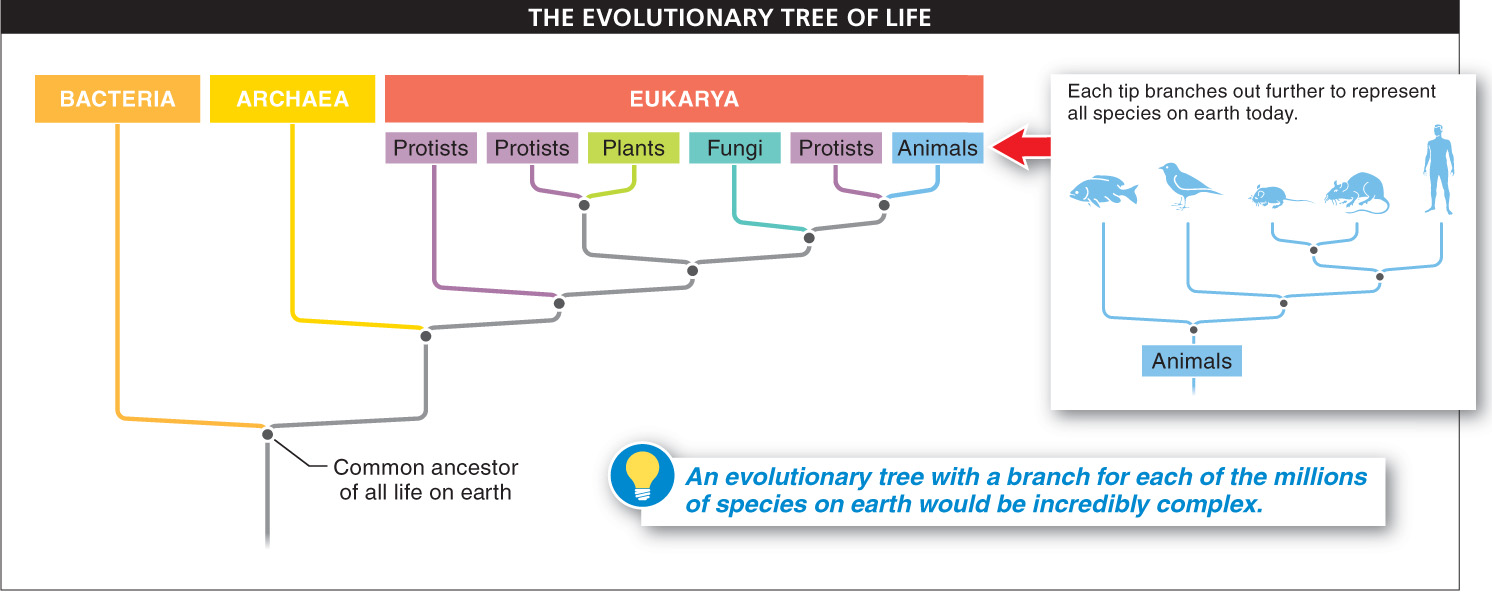
The trunk and branches of an evolutionary tree represent ancestor-
In evolutionary trees, it does not matter on which side of the tree you put a particular group of organisms. Any branches can be spun around the nodes at which they split (see Figure 10-
Are humans more advanced, evolutionarily, than cockroaches? Can bacteria be considered “lower” organisms?
Evolutionary trees tell us many things, but one thing they do not tell us is which groups are most “primitive” and which are most “advanced.” This property of phylogenetic trees can serve to undermine some of our most sacred beliefs, such as the one that humans are the pinnacle of evolution. Many trees can be drawn to support this idea, including Figure 10-
422
What trees do tell us is which groups are most closely related to which other groups. One of the most interesting revelations of “tree thinking” is that—
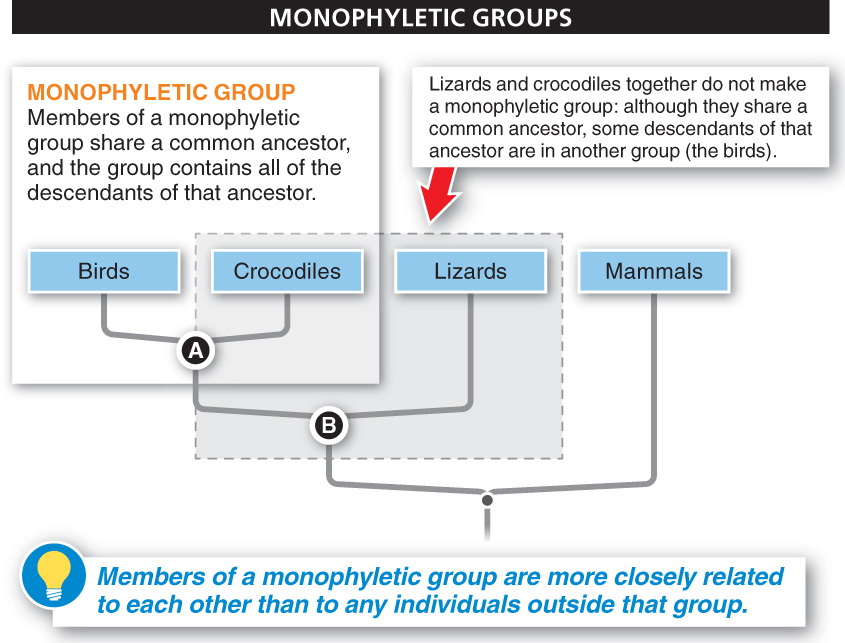
Biologists use the term monophyletic to describe any group in which all of the individuals are more closely related to each other than to any individuals outside that group. Monophyletic groups are determined by looking at the nodes of the trees. For example, birds and crocodiles, taken together, compose a monophyletic group because they share a more recent common ancestor (designated by node A in FIGURE 10-16) than either group shares with lizards or mammals. Lizards and crocodiles, taken together, do not compose a monophyletic group, because their common ancestor (at node B) is also shared by birds. But birds, crocodiles, and lizards, all taken together, do compose a monophyletic group, by virtue of all three sharing the common ancestor at node B. Similarly, birds, crocodiles, lizards, and mammals also compose a monophyletic group. Notice also that in Figure 10-
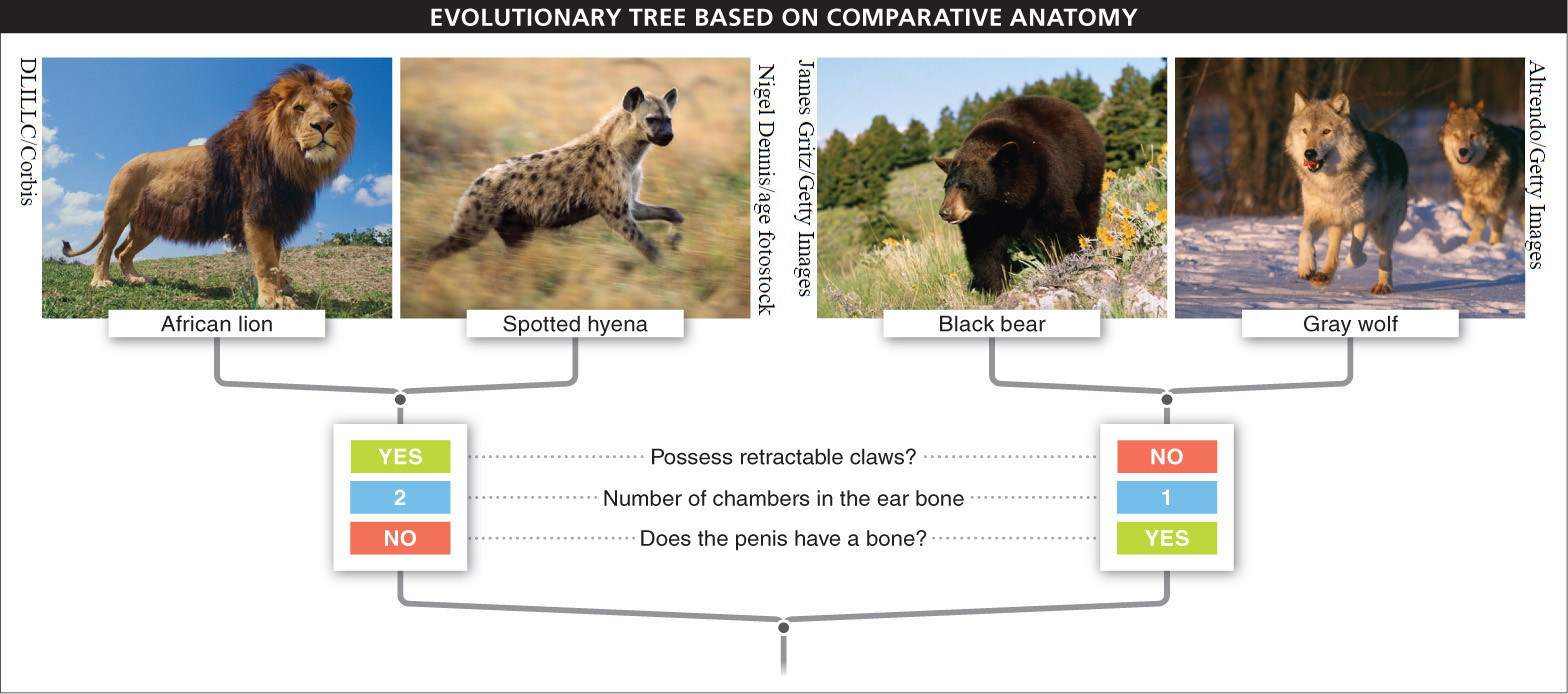
Constructing evolutionary trees by comparing similarities and differences among organisms. Reading an evolutionary tree reveals which groups are most closely related and approximately how long ago they shared a common ancestor. But how are evolutionary trees—
Until recently, these trees were assembled by looking carefully at numerous physical features of species and generating tables that compared these features across the species. FIGURE 10-17 is a simple example of such a table, showing a clear split between the characteristics of the lion and the hyena, on the one hand, and those of the wolf and the bear, on the other. For most of the 20th century, biologists classifying organisms would often use 50 or more traits to generate a tree.
423
“We all should know that diversity makes for a rich tapestry, and we must understand that all the threads of the tapestry are equal in value no matter what their color.”
— MAYA ANGELOU, in Wouldn’t Take Nothing for My Journey Now, 1993
Then, beginning in the 1980s, biologists began using molecular sequences rather than physical traits to generate evolutionary trees. The rationale for this approach is that organisms inherit DNA from their ancestors and so, as species diverge, their DNA sequences also diverge, becoming increasingly different. As more time passes following the splitting of one species into two, the differences in their DNA sequences become greater. By comparing how similar the DNA sequences are between two groups, it is possible to estimate how long ago they shared a common ancestor (FIGURE 10-18).
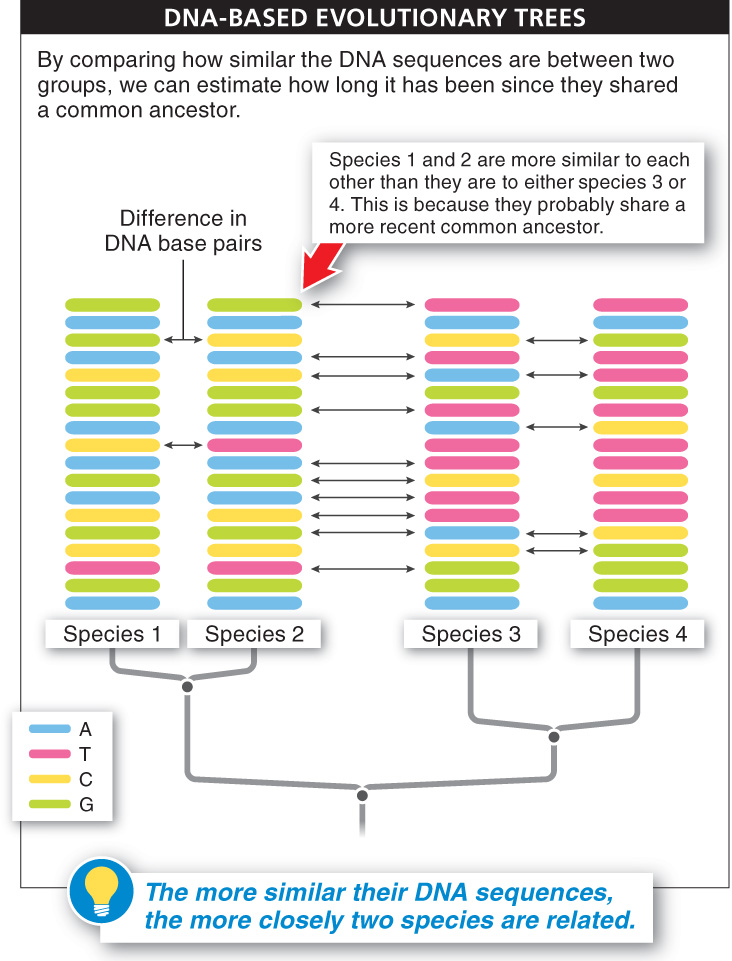
In theory, the construction of evolutionary trees using DNA sequences is not really different from using physical traits. Each DNA base pair can be thought of as a “trait,” and many, many more such “traits” can be compared.
424
Although most evolutionary trees are now produced by using molecular sequence comparisons, when it comes to actually naming species we still use Linnaeus’s system, assigning a species name and fitting the new species within the other categories such as kingdom, class, and family. This can be difficult, because there is no objective way to assign groups above the level of species—
TAKE-HOME MESSAGE 10.9
Evolutionary trees constructed by biologists are hypotheses about the ancestor-
Describe how birds and crocodiles together represent a monophyletic group.
Monophyletic is the term used to describe any group in which all of the individuals are more closely related to each other than to any individuals outside that group. As the example in the textbook notes, birds and crocodiles together make up a monophyletic group because they share a common ancestor, and all of the descendants of that ancestor are included in that group. However, crocodiles and lizards together are not a monophyletic group because some descendants of their common ancestor are in another group—the birds.