
What is the baby boom? Why is it bad news for young people today?
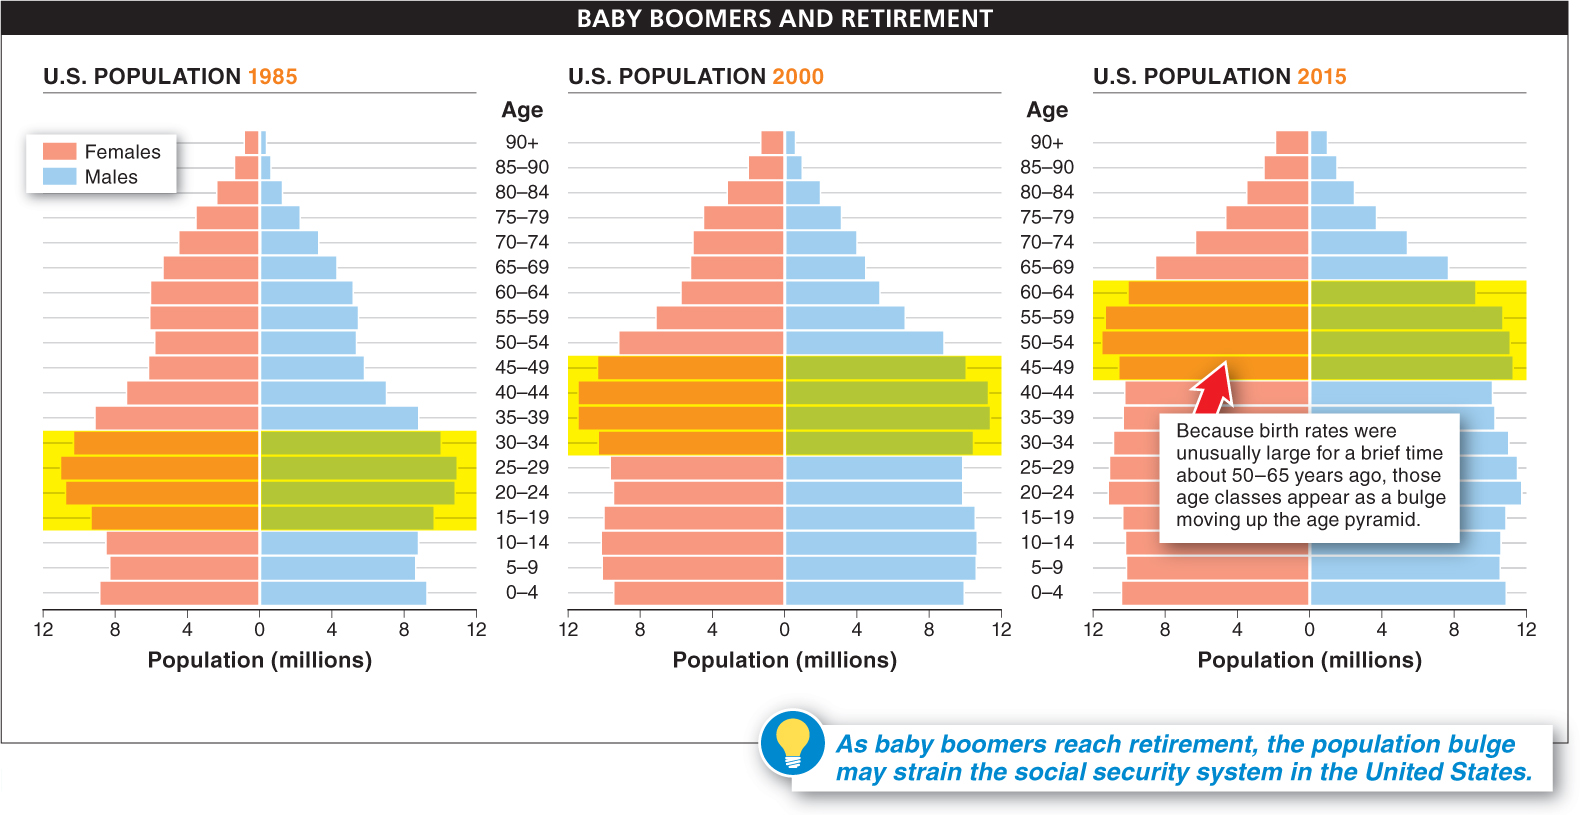
The “baby boom.” It happened half a century ago, yet young people in the United States today may end up paying a price for it. What was it? And why does it still matter? Increasing birth rates caused the baby boom. Beginning just after World War II, and continuing through the early 1960s, families in the United States had about 30% more babies per month than they would have had if they had followed their parents’ pattern. Then the birth rates began to return to their earlier levels, where they have remained since. As the babies from the boom years grew to school age, schools had to increase in size to accommodate all the children. Then the schools had to downsize once the baby boomers had graduated. Now, as these individuals approach retirement age, the question of how their retirement and health care needs will be met is one of the biggest issues facing American society.
Populations often vary across space—
Describing populations in terms of the proportion of individuals in each age group reveals interesting population features. A population can be divided into the percentages of individuals that are in specific age groupings, called cohorts, such as 0–
It can be useful, therefore, for a society to know the relative numbers of 10-
596
Around the world, countries vary tremendously in the age pyramids describing their populations. If two populations are the same size but have different age distributions, they will have some very different features. Most industrialized countries are growing slowly or not at all; most of the population is middle-
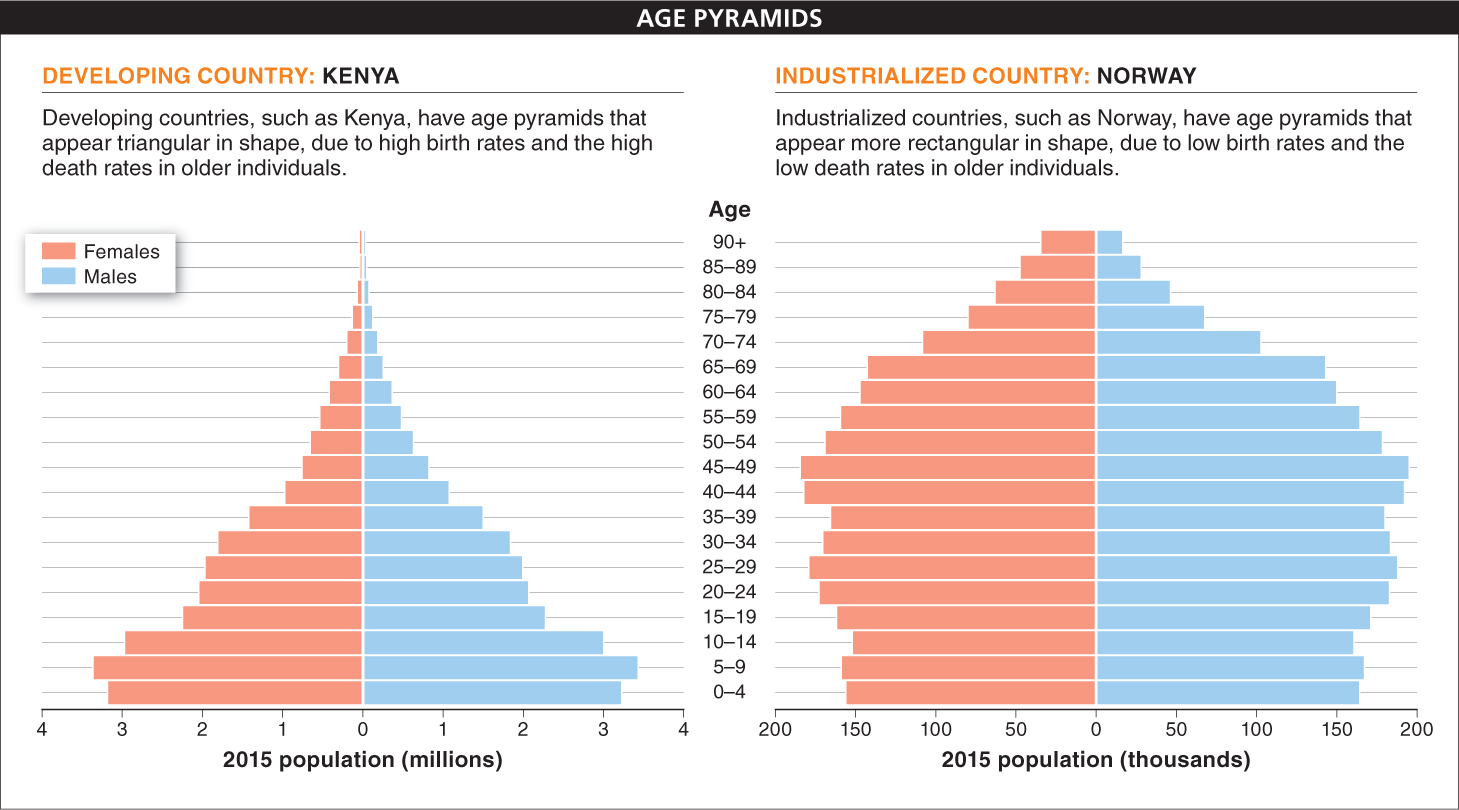
A more triangular shape is seen in the age pyramids of developing countries. Kenya, for example, has very high birth rates, reflected as a large base in its age pyramid (see Figure 14-
Notice the “bulge” in the U.S. age pyramid (FIGURE 14-23). The shape of the U.S. age pyramid has economists worried that the social security system (including Social Security and Medicare) will not be able to offer older citizens sufficient benefits in the next 10–
TAKE-HOME MESSAGE 14.14
Age pyramids show the number of individuals in a population within any age group. They allow us to estimate birth and death rates over multi-
The age pyramid for the United States shows a baby boomer “bulge” resulting from the unusually large number of babies born from the late 1940s to the early 1960s. As these individuals reach retirement age, there is concern that the current number of working individuals is not great enough to sufficiently support retirement system payouts promised to the baby boomers. Why wouldn’t another “baby boom” solve this problem?
The problem is immediate, and individuals born today will take many years to reach the workforce.
597