Answers to Concept Checks
- 1. Two bands
- 2. b
- 3. c
- 4. Initiator protein, helicase, single-strand-binding protein, DNA gyrase.
- 5. c
- 6. b
- 7. c
- 8. The size of eukaryotic genomes, the linear structure of eukaryotic chromosomes, and the association of DNA with histone proteins.
- 9. Because error-prone DNA polymerases can bypass lesions in the DNA helix that stall accurate, high-speed DNA polymerases.
- 10. c
- 11. Recombination is important for genetic variation and for some types of DNA repair.
- 12. d
WORKED PROBLEMS
The following diagram represents the template strands of a replication bubble in a DNA molecule. Draw in the newly synthesized strands and identify the leading and lagging strands.

What information is required in your answer to the problem?
The diagram above with the newly synthesized strands drawn in and the leading and lagging strands labeled.
What information is provided to solve the problem?
A diagram of the template DNA with 5′ and 3′ ends labeled.
For help with this problem, review:
Direction of Replication in Section 12.2 and Figure 12.10c.
Solution Steps
To determine the leading and lagging strands, first note which end of each template strand is 5′ and which end is 3′. With a pencil, draw in the strands being synthesized on these templates, and identify their 5′ and 3′ ends.
Recall: The two strands of DNA are antiparallel, so the newly synthesized strand should have the opposite polarity (direction) as the template strand.
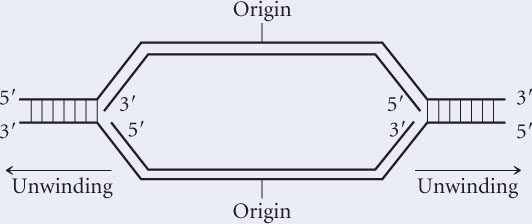
Next, determine the direction of replication for each new strand, which must be 5′→3′. You might draw arrows on the new strands to indicate the direction of replication. After you have established the direction of replication for each strand, look at each fork and determine whether the direction of replication for a strand is the same as the direction of unwinding. The strand on which replication is in the same direction as that of unwinding is the leading strand. The strand on which replication is in the direction opposite that of unwinding is the lagging strand.
Recall: DNA synthesis is always 5′ to 3′.
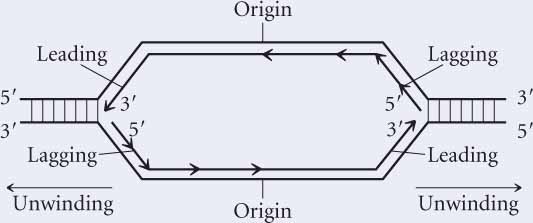
Hint Each replication fork should have one leading and one lagging strand.
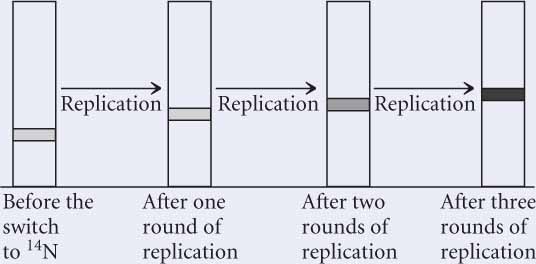
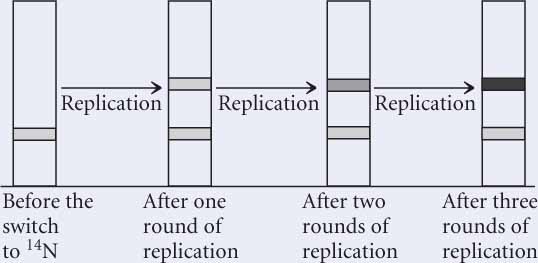
Consider the experiment conducted by Meselson and Stahl in which they used 14N and 15N in cultures of E. coli and equilibrium density gradient centrifugation. Draw pictures to represent the bands produced by bacterial DNA in the density-gradient tube before the switch to medium containing 14N and after one, two, and three rounds of replication after the switch to the medium containing 14N. Use a separate set of drawings to show the bands that would appear if replication were (a) semiconservative; (b) conservative; (c) dispersive.
Solution Strategy
What information is required in your answer to the problem?
Drawings that represent the bands produced by bacterial DNA in density-gradient tubes before the switch to medium containing 14N and after one, two, and three rounds of replication following the switch to the medium containing 14N; thus, you should have drawings of four tubes for each model of replication. You will need a separate set of drawings for semiconservative, conservative, and dispersive replication.
What information is provided to solve the problem?
 The bacterial DNA was originally labeled with 15N and then the bacteria were switched to a medium with 14N.
 Original DNA will have 15N. Newly synthesized DNA will have 14N.
 Density gradient centrifugation was performed before switching to 14N and after one, two, and three rounds of replication following the switch.
For help with this problem, review:
Meselson and Stahl’s Experiment in Section 12.2.
Solution Steps
DNA labeled with 15N will be denser than DNA labeled with 14N; therefore 15N-labeled DNA will sink lower in the density-gradient tube. Before the switch to medium containing 14N, all DNA in the bacteria will contain 15N and will produce a single band in the lower end of the tube.
- a. With semiconservative replication, the two strands separate, and each serves as a template on which a new strand is synthesized. After one round of replication, the original template strand of each molecule will contain 15N and the new strand of each molecule will contain 14N; so a single band will appear in the density gradient halfway between the positions expected of DNA containing only 15N and of DNA containing only 14N. In the next round of replication, the two strands again separate and serve as templates for new strands. Each of the new strands contains only 14N, thus some DNA molecules will contain one strand with the original 15N and one strand with new 14N, whereas the other molecules will contain two strands with 14N. This labeling will produce two bands, one at the intermediate position and one at a higher position in the tube. Additional rounds of replication should produce increasing amounts of DNA that contains only 14N; so the higher band will get darker.
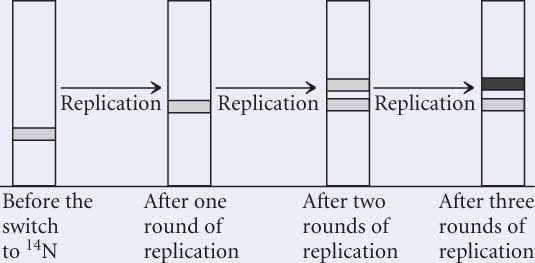
Hint: Review the distribution of new and old DNA in semiconservative, conservative, and dispersive replication in Figure 12.1.
- b. With conservative replication, the entire molecule serves as a template. After one round of replication, some molecules will consist entirely of 15N, and others will consist entirely of 14N; so two bands should be present. Subsequent rounds of replication will increase the fraction of DNA consisting entirely of new 14N; thus the upper band will get darker. However, the original DNA with 15N will remain, and so two bands will be present.
 Page 353
 - c. In dispersive replication, both nucleotide strands break down into fragments that serve as templates for the synthesis of new DNA. The fragments then reassemble into DNA molecules. After one round of replication, all DNA should contain approximately half 15N and half 14N, producing a single band that is halfway between the positions expected of DNA labeled with 15N and of DNA labeled with 14N. With further rounds of replication, the proportion of 14N in each molecule increases; so a single hybrid band remains, but its position in the density gradient will move upward. The band is also expected to get darker as the total amount of DNA increases.
