20.2 Functional Genomics Determines the Function of Genes by Using Genomic-Based Approaches
A genomic sequence is, by itself, of limited use. Merely knowing the sequence would be like having a huge set of encyclopedias without being able to read: you could recognize the different letters but the text would be meaningless. Functional genomics characterizes what the sequences do—their function. The goals of functional genomics include the identification of all the RNA molecules transcribed from a genome, called the transcriptome of that genome, and all the proteins encoded by the genome, called the proteome. Functional genomics uses both bioinformatics and laboratory-based experimental approaches in its search to define the function of DNA sequences.
Chapter 19 considered several methods for identifying genes and assessing their functions, including in situ hybridization, experimental mutagenesis, and the use of transgenic animals and knockouts. These methods can be applied to individual genes and can provide important information about the locations and functions of genetic information. In this section, we will focus primarily on methods that rely on knowing the sequences of other genes or methods that can be applied to large numbers of genes simultaneously.
Predicting Function from Sequence
The nucleotide sequence of a gene can be used to predict the amino acid sequence of the protein that it encodes. The protein can then be synthesized or isolated and its properties studied to determine its function. However, this biochemical approach to understanding gene function is both time consuming and expensive. A major goal of functional genomics has been to develop computational methods that allow gene function to be identified from DNA sequence alone, bypassing the laborious process of isolating and characterizing individual proteins.
Homology Searches
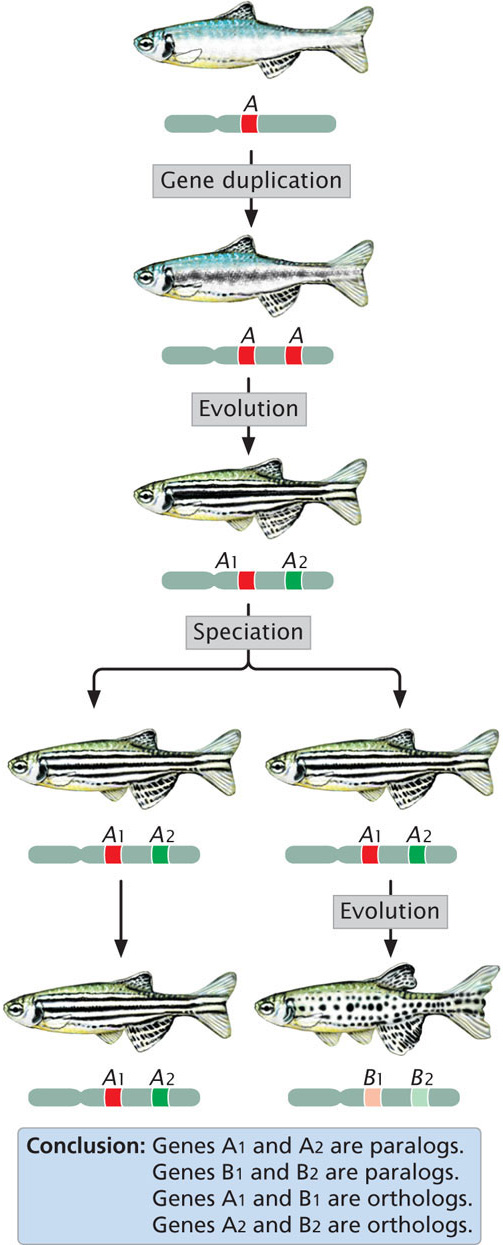
One computational method (often the first employed) for determining gene function is to conduct a homology search, which relies on comparisons of DNA and protein sequences from the same organism and from different organisms. Genes that are evolutionarily related are said to be homologous. Homologous genes found in different species that evolved from the same gene in a common ancestor are called orthologs (Figure 20.9). For example, both mouse and human genomes contain a gene that encodes the alpha subunit of hemoglobin; the mouse and human alpha-hemoglobin genes are said to be orthologs, because both genes evolved from an alpha-hemoglobin gene in a common mammalian ancestor. Homologous genes in the same organism (arising by duplication of a single gene in the evolutionary past) are called paralogs (see Figure 20.9).
592
Within the human genome is a gene that encodes the alpha subunit of hemoglobin and another, homologous gene that encodes the beta subunit of hemoglobin. These paralogs arose because an ancestral gene underwent duplication and the resulting two genes diverged through evolutionary time, giving rise to the alpha- and beta-subunit genes (see Figure 26.18). Homologous genes (both orthologs and paralogs) often have the same or related functions, so, after a function has been assigned to a particular gene, it can provide a clue to the function of a homologous gene.
Databases containing genes and proteins found in a wide array of organisms are available for homology searches. Powerful computer programs, such as BLAST, have been developed for scanning these databases to look for particular sequences. Suppose a geneticist sequences a genome and locates a gene that encodes a protein of unknown function. A homology search conducted on databases containing the DNA or protein sequences of other organisms may identify one or more orthologous sequences. If a function is known for a protein encoded by one of these sequences that could provide information about the function of the newly discovered protein. Sometimes searches do not identify homologous genes; in that case, researchers may look for parts of a gene that are similar to parts of other genes with known function. ![]() TRY PROBLEM 33
TRY PROBLEM 33
Protein Domains
Complex proteins often contain regions that have specific shapes or functions called protein domains. For example, certain DNA-binding proteins attach to DNA in the same way; these proteins have in common a domain that provides the DNA-binding function. Each protein domain has an arrangement of amino acids common to that domain. There are probably a limited, though large, number of protein domains, which have mixed and matched through evolutionary time to yield the protein diversity seen in present-day organisms.
Many protein domains have been characterized, and their molecular functions have been determined. The sequence from a newly identified gene can be scanned against a database of known domains. If the gene sequence encodes one or more domains whose functions have been previously determined, the function of the domain can provide important information about a possible function of the new gene.
CONCEPTS
The function of an unknown gene can sometimes be determined by finding genes with a similar sequence whose function is known. A gene’s function may also be determined by identifying functional domains in the protein that it encodes.
 CONCEPT CHECK 5
What is the difference between orthologs and paralogs?
- Orthologs are homologous sequences; paralogs are analogous sequences.
- Orthologs are more similar than paralogs.
- Orthologs are in the same organism; paralogs are in different organisms.
- Orthologs are in different organisms; paralogs are in the same organism.
Gene Expression and Microarrays
Many important clues about gene function come from knowing when and where the genes are expressed. The development of microarrays has allowed the expression of thousands of genes to be monitored simultaneously.
593
Microarrays rely on nucleic acid hybridization (see Chapter 19), in which a known DNA fragment is used as a probe to find complementary sequences (Figure 20.10). Numerous known DNA fragments are fixed to a solid support in an orderly pattern, or array, usually as a series of dots. These DNA fragments (the probes) usually correspond to known genes from a particular organism.
After the microarray has been constructed, mRNA, DNA, or cDNA isolated from experimental cells is labeled with fluorescent nucleotides and applied to the array. Any of the DNA or RNA molecules that are complementary to probes on the array will hybridize with them and emit fluorescence, which can be detected by an automated scanner. An array containing tens of thousands of probes can be applied to a glass slide or silicon wafer just a few square centimeters in size.
594
The Use of Microarrays
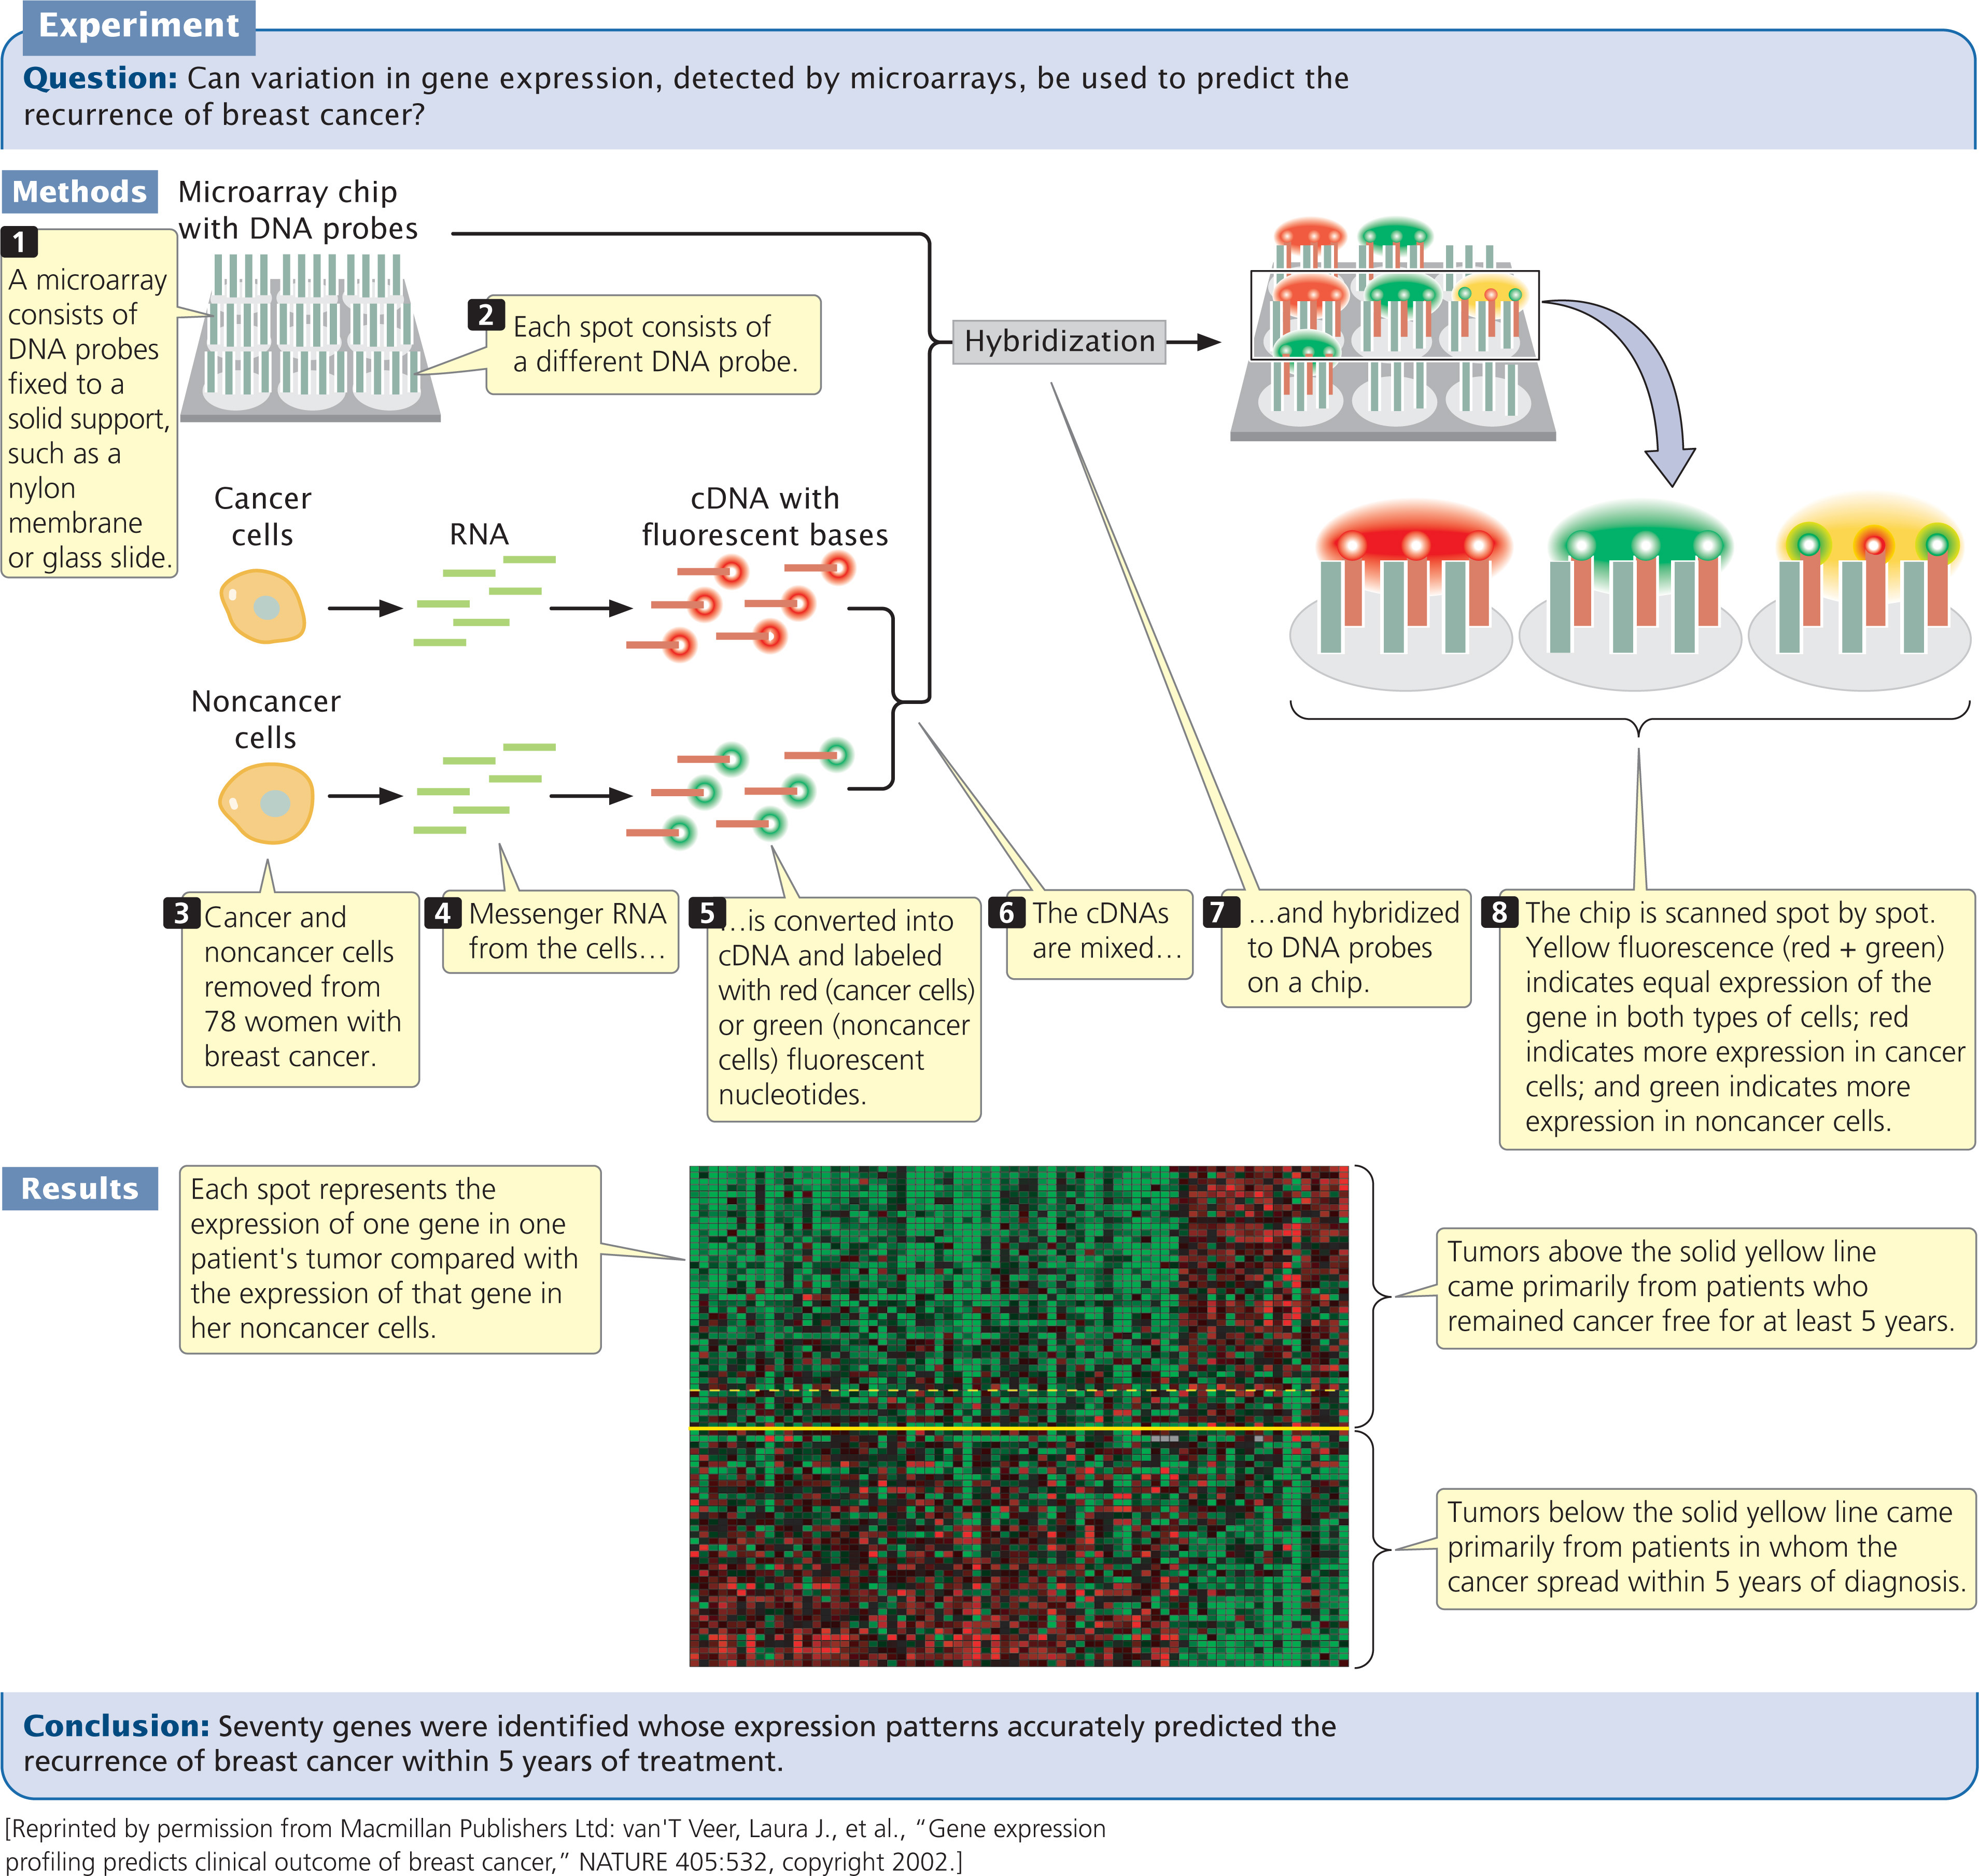
Used with cDNA, microarrays can provide information about the expression of thousands of genes, enabling scientists to study which genes are active in particular tissues. They can also be used to investigate how gene expression changes in the course of biological processes such as development or disease progression. For example, breast cancer affects 1 of 10 women in the United States, and half of those women die from it. Current treatment depends on a number of factors, including a woman’s age, the size of the tumor, the characteristics of the tumor cells, and whether the cancer has already spread to nearby lymph nodes. Many women whose cancer has not spread are treated by removal of the tumor and radiation therapy, yet the cancer later reappears in some of the women thus treated. These women might benefit from more-aggressive treatment when the cancer is first detected.
Using microarrays, researchers examined the expression patterns of 25,000 genes from primary tumors of 78 young women who had breast cancer (Figure 20.10). Messenger RNA from cancer cells and noncancer cells was converted into cDNA and labeled with red fluorescent nucleotides and with green fluorescent nucleotides, respectively. The labeled cDNAs were mixed and hybridized to a DNA chip, which contained DNA probes from different genes. Hybridization of the red (cancer) and green (noncancer) cDNAs was proportional to the relative amounts of mRNA in the samples. The fluorescence of each spot was assessed with microscopic scanning and appeared as a single color. Red indicates the overexpression of a gene in the cancer cells relative to that in the noncancer cells (more red-labeled cDNA hybridizes), whereas green indicates the underexpression of a gene in the cancer cells relative to that in the noncancer cells (more green-labeled cDNA hybridizes). Yellow indicates equal expression in both types of cells (equal hybridization of red-and green-labeled cDNAs), and no color indicates no expression in either type of cell.
In 34 of the 78 patients, the cancer later spread to other sites; the other 44 patients remained free of breast cancer for 5 years after their initial diagnoses. The researchers identified a subset of 70 genes for which the expression patterns in the initial tumors accurately predicted whether the cancer would later spread (see Figure 20.10). This degree of prediction was much higher than that of traditional predictive measures, which are based on the size and histology of the tumor.
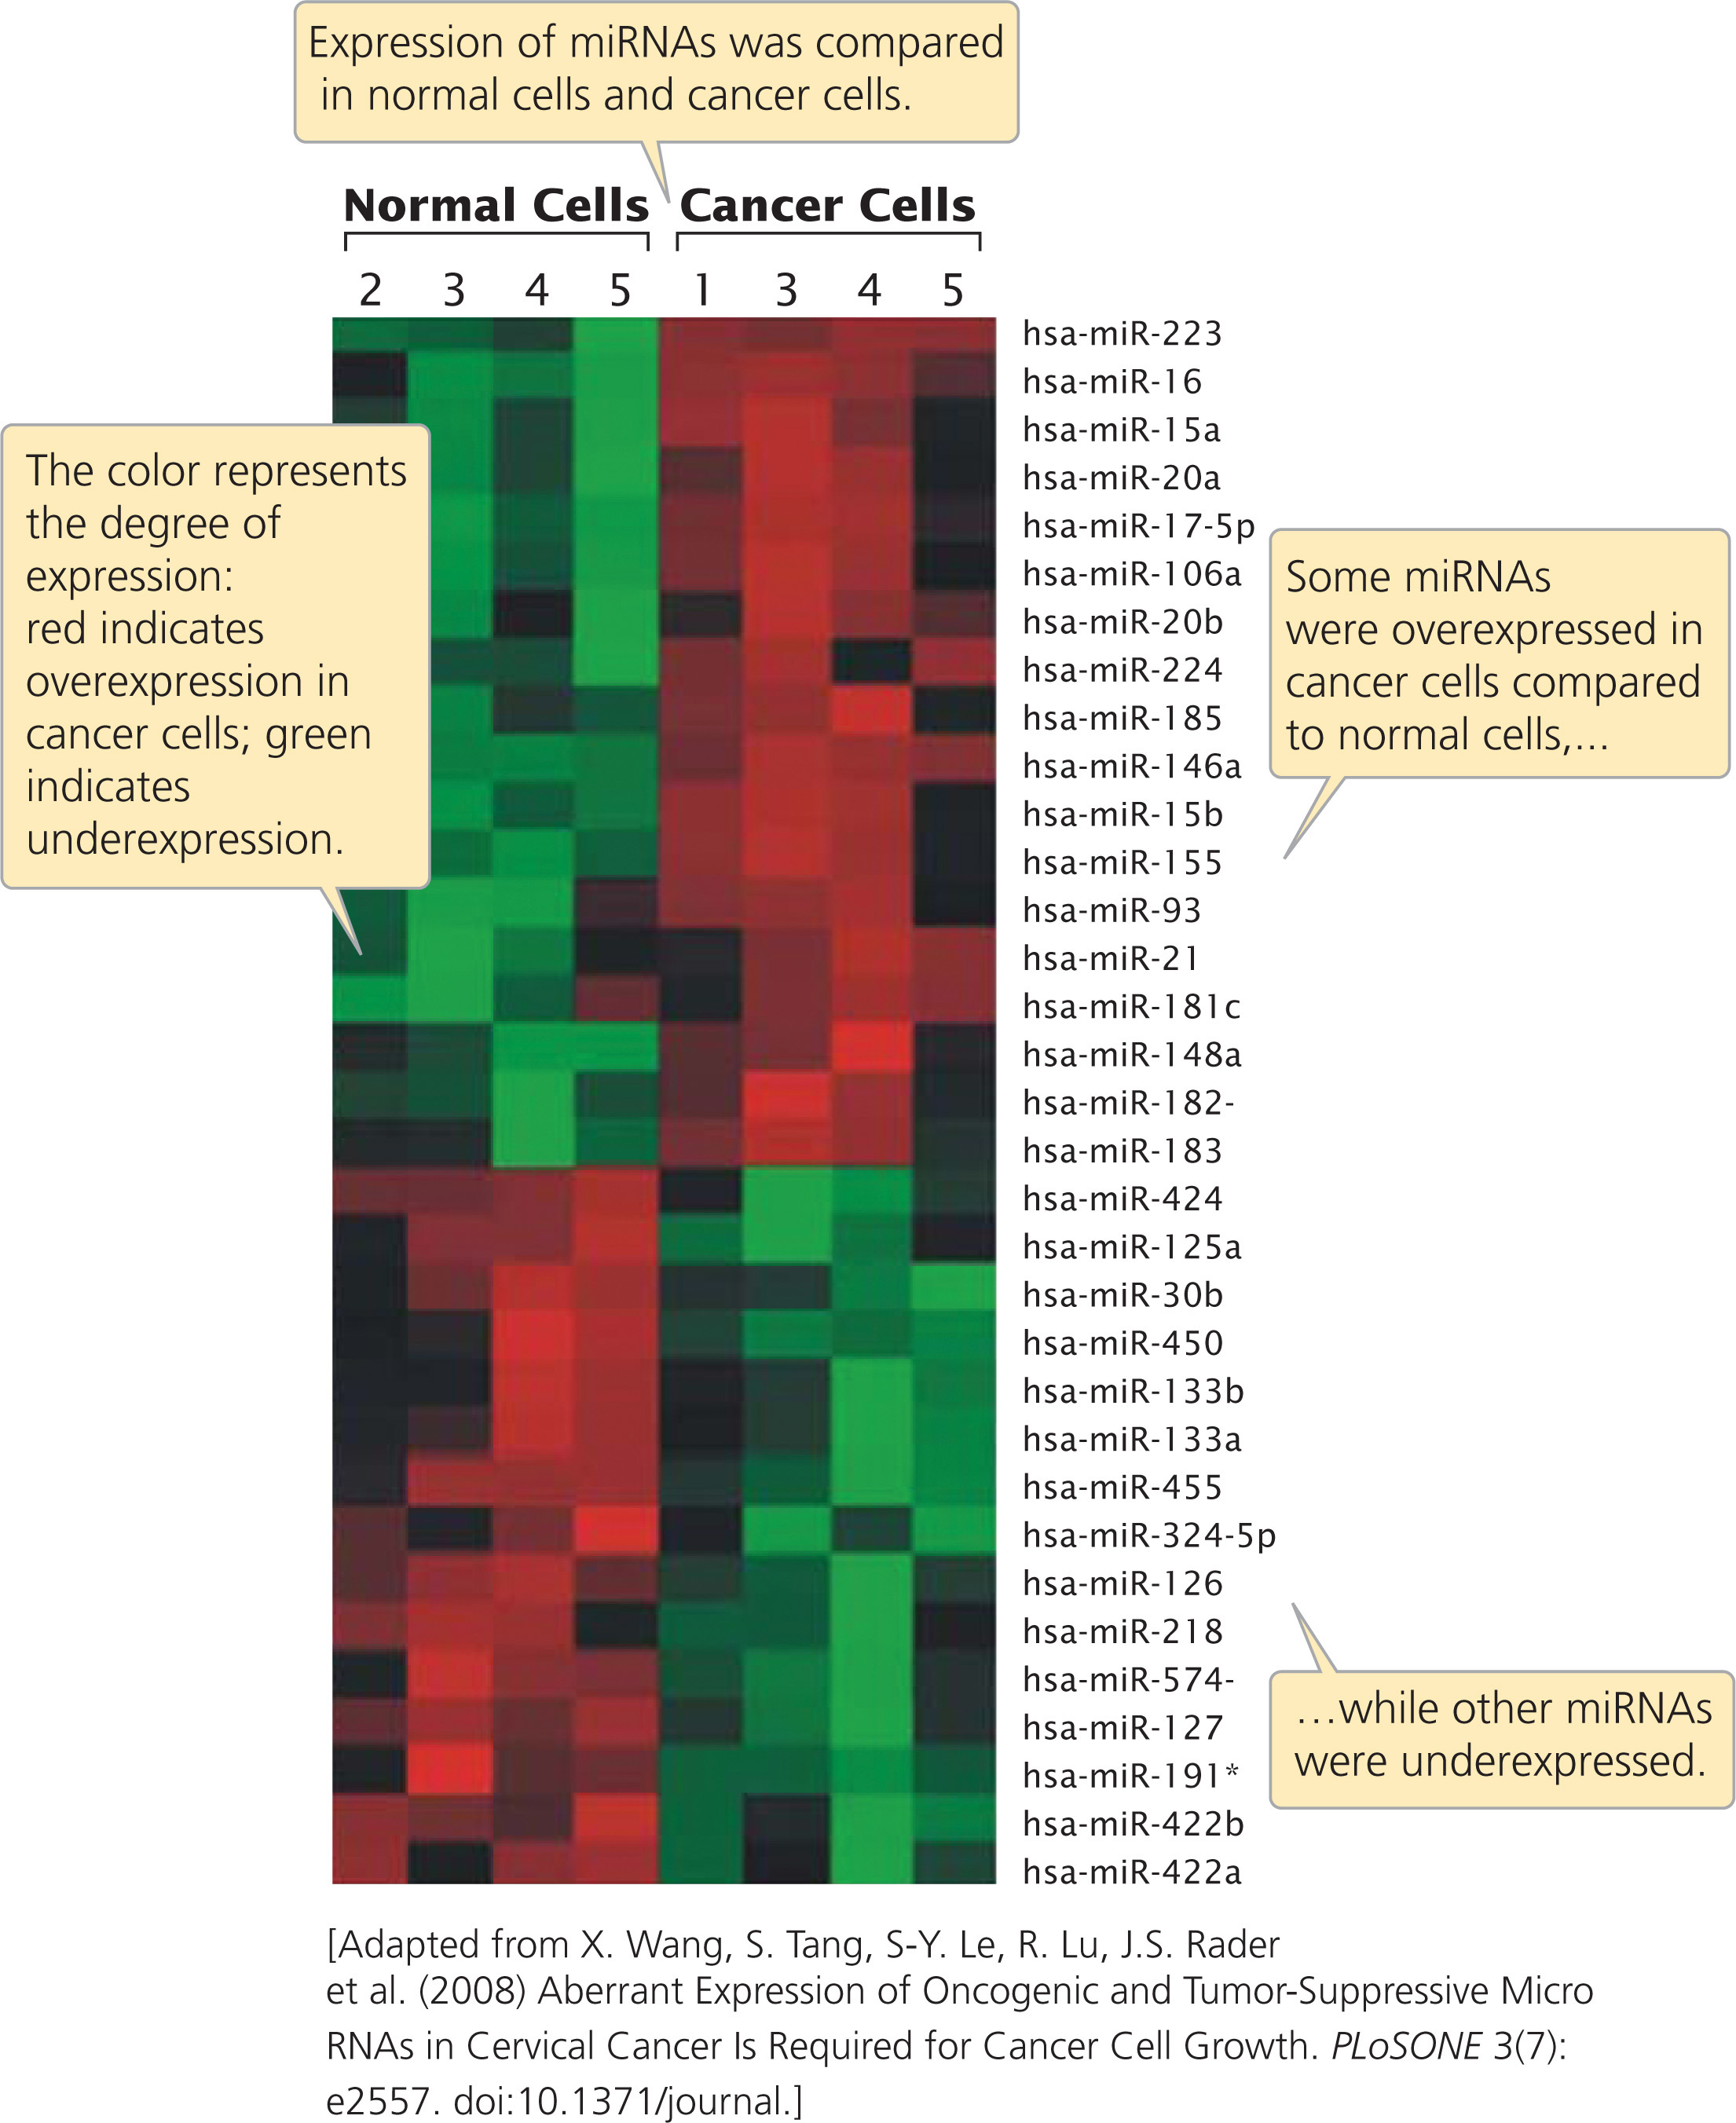
Researchers have also used microarrays to examine the expression of microRNAs (miRNAs) in human cancers. Recent research indicates that miRNAs are frequently expressed abnormally in cancerous tissue and may contribute to the progression of cancer (see Chapter 23). For example, one study using microarrays found that several miRNAs were overexpressed in cancerous cervical tissue, compared to normal cervical tissue, while other miRNAs were underexpressed (Figure 20.11). Other studies using microarrays have demonstrated that miRNA expression is associated with resistance of tumors to chemotherapy and radiation and that miRNA expression can be used to predict the response of some tumors to anticancer treatment. Results such as these suggest that gene-expression data obtained from microarrays can be a powerful tool in determining the nature of cancer research and treatment. The products of the genes that show differences in expression are being examined as possible targets for drug therapy. ![]() TRY PROBLEM 34
TRY PROBLEM 34
Microarrays that allow the detection of specific alleles, SNPs, and even particular proteins also have been created. Importantly, not all DNA molecules bind equally to microarrays, and so microarrays may sometimes overestimate or underestimate the expression of specific genes. Thus, verification of the results of microarrays through other methods is desirable.
595
CONCEPTS
Microarrays, consisting of DNA probes attached to a solid support, can be used to determine which RNA and DNA sequences are present in a mixture of nucleic acids. They are capable of determining which RNA molecules are being synthesized and can thus be used to examine changes in gene expression.
Gene Expression and Reporter Sequences
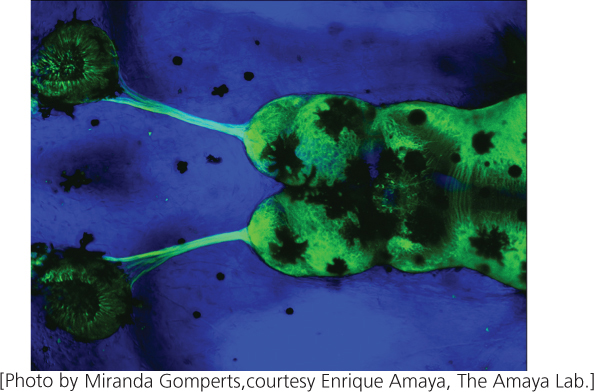
Patterns of gene expression can also be determined visually by using a reporter sequence. In this approach, genomic fragments are first cloned in BACs or other vectors that are capable of holding the coding region of a gene plus its regulatory sequences. The coding region of a gene whose expression is to be studied is then replaced with a reporter sequence, which encodes an easily observed product. For example, a commonly used reporter sequence encodes a green fluorescent protein (GFP) from jellyfish. The BAC is then inserted into an embryo, creating a transgenic organism. The regulatory sequence of the cloned gene ensures that it is expressed at the appropriate time and in the appropriate tissue within the transgenic organism. The product of the gene expression is a fluorescent green pigment, which is easily observed (Figure 20.12).
This technique is being used to study the expression patterns of genes that affect brain function. In the Gene Expression Nervous System Atlas (GENSAT) project, scientists are systematically replacing the coding regions of hundreds of genes with the GFP reporter sequence and observing their patterns of expression in transgenic mice. The goal is to produce a comprehensive atlas of gene expression in the mouse brain. This project has already shed light on where in the brain several genes having roles in inherited neurological disorders are expressed. Another functional genomics project, the Allen Brain Atlas, has compiled information on the expression patterns of 20,000 genes in the mouse brain.
Genome-Wide Mutagenesis
As discussed in Chapter 18, one of the best methods for determining the function of a gene is to examine the phenotypes of individual organisms that possess a mutation in the gene. Traditionally, genes encoding naturally occurring variations in a phenotype were mapped, the causative genes were isolated, and their products were studied. But this procedure was limited by the number of naturally occurring mutations and the difficulty of mapping genes with a limited number of chromosomal markers. The number of naturally occurring mutations can be increased by exposure to mutagenic agents, and the accuracy of mapping is increased dramatically by the availability of mapped molecular markers, such as RFLPs, microsatellites, STSs, ESTs, and SNPs. These two methods—random inducement of mutations on a genome-wide basis, and mapping with molecular markers—are coupled and automated in a mutagenesis screen.
Genome-wide mutagenesis screens can be used to search for all genes affecting a particular function or trait. For example, mutagenesis screens of mice are being used to identify genes having roles in cardiovascular function. When these genes are located in mice, homology searches are carried out to determine if similar genes exist in humans. Those genes can then be studied to better understand cardiac disease in humans.
To conduct a mutagenesis screen, random mutations are induced in a population of organisms, creating new phenotypes. The mutations are induced by exposing the organisms to radiation, a chemical mutagen (see Chapter 18), or transposable elements (DNA sequences that insert randomly into the DNA; see Chapter 18). The procedure for a typical mutagenesis screen is illustrated in Figure 20.13. Here, male zebrafish are treated with ethylmethylsulfonate (EMS), a chemical that induces germ-line mutations in their sperm. The treated males are mated with wild-type female fish. A few of the offspring will be heterozygous for mutations induced by EMS; the offspring are screened for any mutant phenotypes that might be the products of dominant mutations expressed in these heterozygous fish. Recessive mutations will not be expressed in the F1 progeny but can be revealed with further breeding.
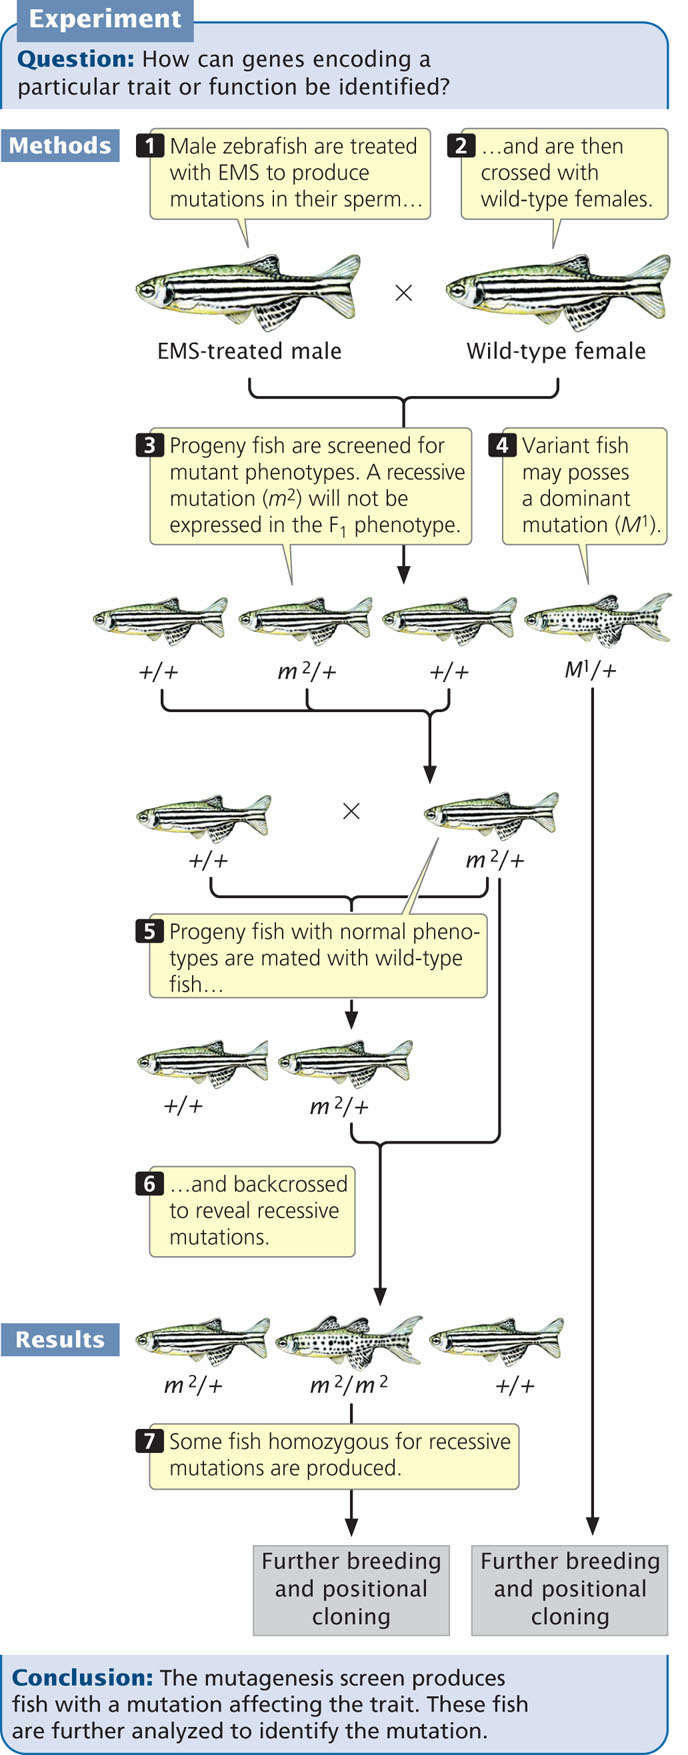
The fish with variant phenotypes undergo further breeding experiments to verify that each variant phenotype is, in fact, due to a single-gene mutation, although the gene in which the mutation occurs is not known. The gene can be located, however, by positional cloning (see Chapter 19).
Mutagenesis screens have been used to study genes that control vertebrate development. A team of developmental geneticists have produced thousands of mutations in the zebrafish that affect development and are systematically locating and characterizing the loci where the mutations occur. Zebrafish are ideal genetic models for this type of study because they reproduce quickly, are easily reared in the laboratory, and have transparent embryos in which developmental deformities are easy to spot. This research has already identified a number of genes that are important in embryonic development, many of which have counterparts in humans.
596
CONCEPTS
Genome-wide mutagenesis screening coupled with positional cloning can be used to identify genes that affect a specific characteristic or function.
CONCEPT CHECK 6
Which is the correct order of steps in a mutagenesis screen?
- Positional cloning, mutagenesis, identification of mutants, verification of genetic basis.
- Mutagenesis, positional cloning, identification of mutants, verification of genetic basis.
- Mutagenesis, identification of mutants, verification of genetic basis, positional cloning.
- Identification of mutants, positional cloning, mutagenesis, verification of genetic basis.