Chapter 3
Useful characteristics: Easy to grow and maintain; grows rapidly, produces many generations in a short period. Examples of organisms: Neurospora, a fungus; Saccharomyces cerevisiae, a yeast; Arabidopsis, a plant; Caenorhabditis elegans, a nematode; Drosophila melanogaster, a fruit fly.
Although the white female gave birth to the offspring, her eggs were produced by the ovary from the black female guinea pig. The transplanted ovary produced only eggs containing the allele for black coat color.
The white male guinea pig contributed a w allele, while the white female guinea pig contributed the W allele from the transplanted ovary. The offspring are thus Ww.
The production of black offspring suggests that the allele for black coat color was passed to the offspring from the transplanted ovary, in agreement with the germ-
plasm theory. If pangenesis were correct, the white coat alleles from the female’s body would have traveled to the transplanted ovary and then to into the gametes. The absence of any white offspring indicates that pangenesis did not occur.
Female parent is iBiB; male parent is IAiB.
Both parents are iBiB.
Male parent is iBiB; female parent is IAIA or, possibly, IAiB, but a heterozygous female in this mating is unlikely to have produced eight blood-
type- A kittens owing to chance alone. Both parents are IAiB.
Either both parents are IAIA or one parent is IAIA and the other parent is IAiB.
Female parent is iBiB; male parent is IAiB.
Sally is Aa, Sally’s mother is Aa, Sally’s father is aa, and Sally’s brother is aa.
½
½
Because 2 is found on only one side of a six-
sided die, there is a  chance of rolling a 2.
The probability of rolling a 1 on a six-
sided die is , and the probability of rolling a 2 on a six-sided die is . Use the addition rule of probability to determine the probability of rolling a 1 or a 2:  .
.A single die contains three even numbers (2, 4, 6). The probability of rolling any one of these three numbers is
. To apply the addition rule: 
The number 6 is found on only one side of a six-
sided die. The probability of rolling a 6 is therefore . The probability of rolling any number but 6 is 
(a)
 ; (b)
; (b)  ; (c)
; (c)  ; (d) ; (e)
  ; (f)
; (f)  .
.
Parents:
F1 generation:
F2 generation:
In the F1 black guinea pigs (Bb), only one of the two homologous chromosomes possesses the black allele, and so the number of copies present at each stage are as follows: G1, one black allele; G2, two black alleles; metaphase of mitosis, two black alleles; metaphase I of meiosis, two black alleles; after cytokinesis of meiosis, one black allele but only in half of the cells produced by meiosis.
In the F1 brown guinea pigs (bb), both homologs possess the brown allele, and so the number of copies present at each stage are as follows: G1, two brown alleles; G2, four brown alleles; metaphase of mitosis, four brown alleles; metaphase I of meiosis, four brown alleles; metaphase II, two brown alleles; after cytokinesis of meiosis, one brown allele.
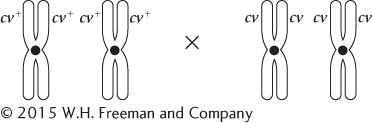
The parents are gg CuCu × GG cucu, and they produce F1 progeny with genotype Gg Cucu. If two F1 cats mated (Gg Cucu × Gg Cucu), the phenotypic ratios expected in the F2 are as follows:
 black with curly ears (G_ Cu_)
 black with normal ears (G_ cucu) gray with curly ears (gg Cu_)
 gray with normal ears (gg cucu)
The mating of an F1 cat (Gg Cucu) with a gray cat with normal ears (gg cucu) is expected to produce the following progeny:
¼ black with curly ears (Gg Cucu)
¼ black with normal ears (Gg cucu)
¼ gray with curly ears (gg Cucu)
¼ gray with normal ears (gg cucu)


No offspring have this genotype. The Aa Bb Cc dd Ee parent cannot contribute a D allele, and the Aa bb Cc Dd Ee parent cannot contribute a B allele. Therefore, their offspring cannot be homozygous for the BB and DD gene loci.
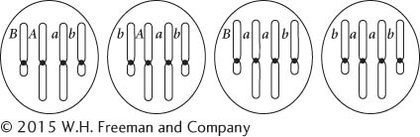
Gametes from Aa Bb individual:
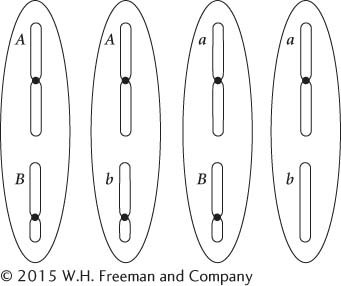
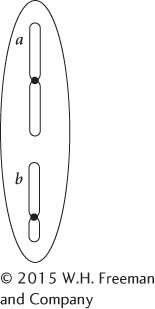
Gametes from aa bb individual:
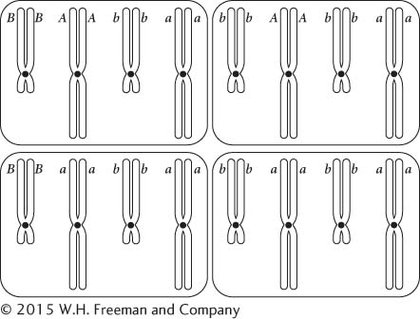
Progeny at G1:
Progeny at G2:
Progeny at metaphase of mitosis:
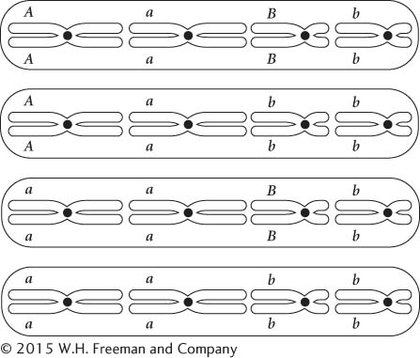
The order of chromosomes on the metaphase plate can vary.
The burnsi × burnsi cross produced both burnsi and pipiens offspring, indicating that the parents were heterozygous, with each possessing a burnsi allele and a pipiens allele. This cross indicates that the burnsi allele is dominant over the pipiens allele. The progeny of the burnsi × pipiens crosses suggest that each of the crosses was between a homozygous recessive frog (pipiens) and a heterozygous dominant frog (burnsi). The results of both crosses are consistent with the burnsi phenotype being dominant to the pipiens phenotype.
Let B represent the burnsi allele and B+ represent the pipiens allele.
burnsi (BB+) × burnsi (BB+)
burnsi (BB+) × pipiens (B+B+)
burnsi (BB+) × pipiens (B+B+)
For the burnsi × burnsi (BB+ × BB+) cross, we would expect a phenotypic ratio of 3:1 in the offspring. A chi-
square test gives a chi- square value of 2.706 with 1 degree of freedom and a probability between 0.1 and 0.05, indicating that the differences between what we expected and what we observed could have been generated by chance. For the first burnsi × pipiens (BB+ × B+B+) cross, we expect a phenotypic ratio of 1:1. A chi- square test yields χ2 = 1.78, df = 1, P > 0.05. For the second burnsi × pipiens (BB+ × B+B+) cross, we expect a phenotypic ratio of 1:1. A chi- square test yields χ2 = 0.46, df = 1, P > 0.05. Thus, all three crosses are consistent with the predication that burnsi is dominant over pipiens.
A heterozygous F1 plant (Cc Ff) is crossed to a homozygous recessive plant (cc ff) We expect a 1:1:1:1 phenotypic ratio in the progeny, or ¼ of each phenotype. A chi-
square test yields a chi- square value of 35 with df = 3 and P < 0.005. The probability that chance produced the differences between the observed and the expected ratios is very low, indicating that the progeny are not in a 1:1:1:1 ratio.
The number of plants with the cc ff genotype is much less than expected. Poppies with the cc ff genotype may be less viable than other genotypes.
The alleles for obesity from both laboratories are recessive, but they are located at different gene loci.
Obese mouse from laboratory 1 (o1o1 O2O2)
Obese mouse from laboratory 2 (O1O1 o2o2)
P
o1o1 O2O2 × O1O1 o2o2
↓ F1
All normal (O1o1 O2o2)