The Variance
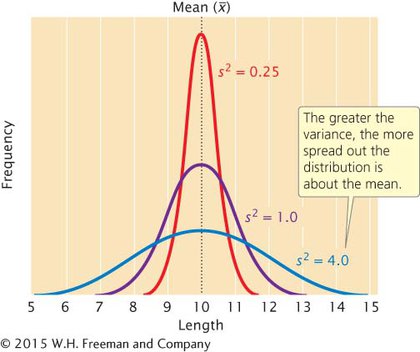
A statistic that provides key information about a distribution is its variance, which indicates the variability of a group of measurements, or how spread out the distribution is. Distributions can have the same mean but different variances (Figure 17.9). The larger the variance, the greater the spread of measurements in a distribution around its mean.

The variance (s2) is defined as the average squared deviation from the mean:

To calculate the variance, we (1) subtract the mean from each measurement and square the value obtained, (2) add all of these squared deviations together, and (3) divide that sum by the number of original measurements minus 1. For example, suppose that we wanted to calculate the variance for the five heights mentioned earlier (160, 161, 167, 164, and 165 cm). As already shown, the mean of these heights is 163.4 cm. The variance for the heights is

CONCEPTS
The mean and the variance are statistics that describe a frequency distribution: the mean provides information about the location of the center of a distribution, and the variance provides information about its variability.