Locating Genes That Affect Quantitative Characteristics
The statistical methods we have just described can be used both to make predictions about the average phenotype expected in offspring and to estimate the overall contribution of genes to variation in a characteristic. These methods do not, however, allow us to identify and determine the influence of individual genes that affect quantitative characteristics. As stated in the introduction to this chapter, chromosome regions with genes that control polygenic characteristics are referred to as quantitative trait loci (QTLs). Although quantitative genetics has made important contributions to basic biology and to plant and animal breeding, our inability to identify QTLs and to measure their individual effects severely limited the application of quantitative genetic methods until recently.
MAPPING QTLs In recent years, numerous genetic markers have been identified and mapped with the use of molecular techniques, making it possible to identify QTLs by linkage analysis. The underlying idea is simple: if the inheritance of a genetic marker is associated consistently with the inheritance of a particular phenotype, then that marker must be linked to a QTL that affects that phenotype. Any correlation between the inheritance of a particular marker allele and a quantitative phenotype in a series of crosses indicates that a QTL is physically linked to that marker. If enough markers are used, the detection of all the QTLs affecting a characteristic is theoretically possible.
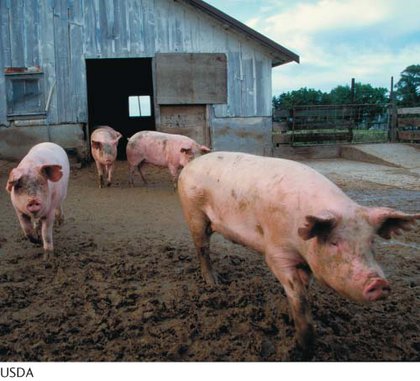
It is important to recognize that a QTL is not a gene; rather, a QTL is a map location for a chromosome region that is associated with a quantitative trait. After a QTL has been identified, it can be studied for the presence of one or more specific genes or other sequences that influence the trait. The introduction to this chapter considers how this approach was used to identify a major gene that affects the oil content of corn. QTL mapping has been used to detect genes affecting a variety of characteristics in plant and animal species (Figure 17.13 and Table 17.3).

| Organism | Quantitative characteristic | |
|---|---|---|
| Tomato | Soluble solids Fruit mass Fruit pH Growth Leaflet shape Height |
|
| Corn | Height Leaf length Tiller number Glume hardness Grain yield Number of ears Thermotolerance |
|
| Common bean | Number of root nodules | |
| Mung bean | Seed weight | |
| Cow pea | Seed weight | |
| Wheat | Preharvest sprout | |
| Pig | Growth Length of small intestine Average back fat Abdominal fat |
|
| Mouse | Epilepsy | |
| Rat | Hypertension | |
|
Source: After S. D. Tanksley, Mapping polygenes, Annual Review of Genetics 27:218, 1993. |
||
GENOME-
An alternative technique for identifying genes that affect quantitative traits is to conduct genome-
Genome-
CONCEPTS
The availability of numerous genetic markers revealed by molecular methods makes it possible to map chromosome segments containing genes that contribute to polygenic characteristics. Genome-