Predicting the Response to Selection
When a quantitative characteristic is subjected to natural or artificial selection, it is likely to change with the passage of time, provided that there is genetic variation for that characteristic in the population. Suppose that a dairy farmer wants to increase milk production among the cows in his herd. Variation at several loci potentially affects milk production in cows; some alleles at these loci confer high milk production, whereas other alleles confer low milk production. The dairy farmer breeds only those cows in his herd that have the highest milk production. If there is genetic variation in milk production (i.e., there are different alleles at the loci that control milk production), the mean milk production in the daughters of the selected cows should be higher than the mean milk production of the original herd. This increased production is due to the fact that the selected cows possess more alleles for high milk production than does the average cow, and these alleles are passed on to the offspring. Thus, the offspring of the selected cows possess a higher proportion of alleles for high milk production, and therefore produce more milk, than the average cow in the initial herd.
The extent to which a characteristic subjected to selection changes in one generation is termed the response to selection. Suppose that the average cow in a dairy herd produces 80 liters of milk per week. A farmer selects for increased milk production by breeding the highest milk producers, and the female progeny of those selected cows produce 100 liters of milk per week on average. The response to selection is calculated by subtracting the mean phenotype of the original population (80 liters) from the mean phenotype of the offspring (100 liters), obtaining a response to selection of 100 − 80 = 20 liters per week.
FACTORS INFLUENCING RESPONSE TO SELECTION The response to selection is determined primarily by two factors. First, it is affected by narrow-
The second factor that determines the response to selection is how much selection there is. If the farmer is very stringent in the choice of parents and breeds only the highest milk producers in the herd (say, the top 3 cows), then all the offspring will receive genes for high milk production. If the farmer is less selective and breeds the top 20 milk producers in the herd, then the offspring will not carry as many genes for high milk production, and on average, they will not produce as much milk as the offspring of the top 3 producers would. The response to selection thus depends on the degree to which the selected parents differ from the rest of the population; this difference is measured by the selection differential, defined as the difference between the mean phenotype of the selected parents and the mean phenotype of the original population. If the average milk production of the original herd is 80 liters and the farmer breeds cows with an average milk production of 120 liters, then the selection differential is 120 − 80 = 40 liters.
CALCULATION OF RESPONSE TO SELECTION The response to selection (R) depends on narrow-
R = h2 × S (17.10)
This equation can be used to predict the magnitude of change in a characteristic when a given selection differential is applied. G. A. Clayton and his colleagues estimated the response to selection that would take place in the abdominal bristle number of Drosophila melanogaster. By using several different methods, they first estimated the narrow-
R = 0.52 × 5.3 = 2.8
The response to selection of 2.8 is the expected increase in the characteristic in the offspring above the mean of the original population. They therefore predicted that the average number of abdominal bristles in the offspring of their selected flies would be 35.3 + 2.8 = 38.1. Indeed, they found an average bristle number of 37.9 in these flies.
ESTIMATING HERITABILITY FROM RESPONSE TO SELECTION Rearranging Equation 17.10 provides another way to calculate narrow-
In this way, h2 can be calculated by conducting a response-
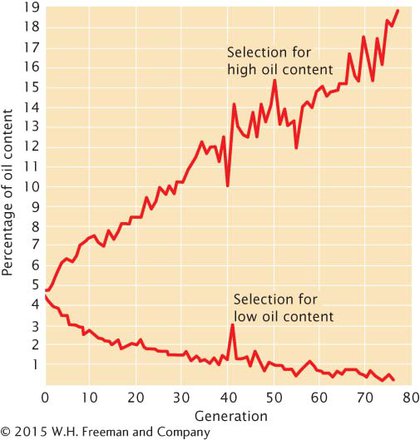
One of the longest- TRY PROBLEM 23
CONCEPTS
The response to selection is influenced by narrow-
 CONCEPT CHECK 3
The narrow-
0.2