APPLICATION QUESTIONS AND PROBLEMS
Question 22
22.How would you respond to someone who said that models are useless in studying population genetics because they represent oversimplifications of the real world?
Question 23
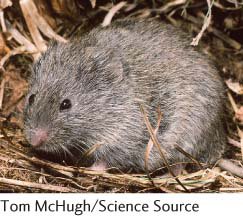
*23.Voles (Microtus ochrogaster) were trapped in fields in southern Indiana and genotyped for a transferrin locus. The following numbers of genotypes were recorded, where TE and TF represent different alleles.
| TETE | TETF | TFTF |
|---|---|---|
| 407 | 170 | 17 |
Calculate the genotypic and allelic frequencies of the transferrin locus for this population.
Question 24
24. Jean Manning, Charles Kerfoot, and Edward Berger studied the allelic frequencies at the glucose phosphate isomerase (GPI) locus in the cladoceran Bosmina longirostris (a small crustacean known as a water flea). They collected 176 of the animals from a single location in Union Bay in Seattle, Washington, and determined their GPI genotypes by using electrophoresis (J. Manning, W. C. Kerfoot, and E. M. Berger. 1978. Evolution 32:365–374).
| Genotype | Number |
|---|---|
| S1S1 | 4 |
| S1S2 | 38 |
| S2S2 | 134 |
Determine the genotypic and allelic frequencies for this population.
Question 25
25.A total of 6129 North American Caucasians were blood typed for the MN locus, which is determined by two codominant alleles, LM and LN. The following data were obtained:
| Blood type | Number |
|---|---|
| M | 1787 |
| MN | 3039 |
| N | 1303 |
Carry out a chi-
Question 26
26.Assume that the phenotypes of the lady beetles shown in Figure 18.1b are encoded by the following genotypes:
| Phenotype | Genotype |
|---|---|
| All black | BB |
| Some black spots | Bb |
| No black spots | bb |
For the lady beetles shown in the figure, calculate the frequencies of the genotypes and frequencies of the alleles.
Use a chi-
square test to determine if the lady beetles shown are in Hardy Weinberg equilibrium.
Question 27
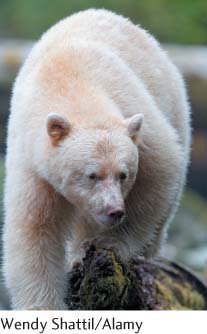
*27. Most black bears (Ursus americanus) are black or brown in color. However, occasional white bears of this species appear in some populations along the coast of British Columbia. Kermit Ritland and his colleagues determined that white coat color in these bears results from a recessive mutation (G) caused by a single nucleotide replacement in which guanine substitutes for adenine at the melanocortin-
| Genotype | Number |
|---|---|
| AA | 42 |
| AG | 24 |
| GG | 21 |
What are the frequencies of the A and G alleles in these bears?
Give the genotypic frequencies expected if the population is in Hardy–Weinberg equilibrium.
Use a chi-
square test to compare the number of observed genotypes with the number expected under Hardy–Weinberg equilibrium. Is this population in Hardy–Weinberg equilibrium? Explain your reasoning.
Question 28
28.Genotypes of leopard frogs from a population in central Kansas were determined for a locus (M) that encodes the enzyme malate dehydrogenase. The following numbers of genotypes were observed:
| Genotype | Number |
|---|---|
| M1M1 | 20 |
| M1M2 | 45 |
| M2M2 | 42 |
| M1M3 | 4 |
| M2M3 | 8 |
| M3M3 | 6 |
| Total | 125 |
Calculate the genotypic and allelic frequencies for this population.
What would the expected numbers of genotypes be if the population were in Hardy–Weinberg equilibrium?
Question 29
*29.Full color (D) in domestic cats is dominant over dilute color (d). Of 325 cats observed, 194 have full color and 131 have dilute color.
If this population of cats is in Hardy–Weinberg equilibrium for the dilution locus, what is the frequency of the dilute (d) allele?
How many of the 194 cats with full color are likely to be heterozygous?
Question 30
30.Tay–Sachs disease is an autosomal recessive disorder. Among Ashkenazi Jews, the frequency of Tay–Sachs disease is 1 in 3600. If the Ashkenazi population is mating randomly for the Tay–Sachs gene, what proportion of the population consists of heterozygous carriers of the Tay–Sachs allele?
Question 31
*31.The human MN blood type is determined by two codominant alleles, LM and LN. The frequency of LM in Eskimos on a small Arctic island is 0.80.
If random mating takes place in this population, what are the expected frequencies of the M, MN, and N blood types on the island?
If inbreeding is present in this population, what effect will it have on the expected numbers of the different blood types?
Question 32
*32.Pikas are small mammals that live at high elevations on the talus slopes of mountains. Most populations located on mountaintops in Colorado and Montana in North America are isolated from one another: the pikas don’t occupy the low-
Question 33
*33.Two chromosome inversions are commonly found in populations of Drosophila pseudoobscura: Standard (ST) and Arrowhead (AR). When the flies are treated with the insecticide DDT, the genotypes for these inversions exhibit overdominance, with the following fitnesses:
| Genotype | Fitness |
|---|---|
| ST/ST | 0.47 |
| ST/AR | 1 |
| AR/AR | 0.62 |
What will the frequencies of ST and AR be after equilibrium has been reached?
Question 34
*34. The fruit fly Drosophila melanogaster normally feeds on rotting fruit, which may ferment and contain high levels of alcohol. Douglas Cavener and Michael Clegg studied allelic frequencies at the locus for alcohol dehydrogenase (Adh) in experimental populations of D. melanogaster (D. R. Cavener and M. T. Clegg. 1981. Evolution 35:1–10). The experimental populations were established from wild-
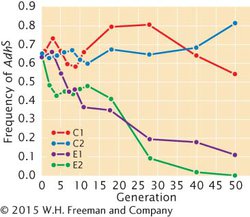
On the basis of these data, what conclusion might you draw about the evolutionary forces that are affecting the Adh alleles in these populations?
Cavener and Clegg measured the viability of the different Adh genotypes in the ethanol environment and obtained the following values:
| Genotype | Relative viability |
|---|---|
| AdhF/AdhF | 0.932 |
| AdhF/AdhS | 1.288 |
| AdhS/AdhS | 0.596 |
Using these relative viabilities, calculate relative fitnesses for the three genotypes.
Question 35
35.Examine Figure 18.8. Which evolutionary forces
cause an increase in genetic variation both within and between populations?
cause a decrease in genetic variation both within and between populations?
cause an increase in genetic variation within populations but cause a decrease in genetic variation between populations?
Question 36
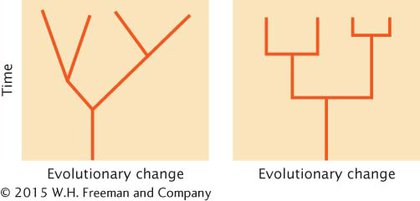
*36.The following illustrations represent two different patterns of evolution. Briefly discuss the differences in these two patterns, particularly in regard to the role of cladogenesis in evolutionary change.
Question 37
37.Which of the isolating mechanisms listed in Table 18.3 have partly evolved between apple and hawthorn host races of Rhagoletis pomonella?
Question 38
*38. In Section 18.5, we considered the sympatric evolution of reproductive isolating mechanisms in host races of Rhagoletis pomonella, the apple maggot fly. The wasp Diachasma alloeum parasitizes apple maggot flies, laying its eggs on the larvae of the flies. Immature wasps hatch from the eggs and feed on the fly larvae. Research by Andrew Forbes and his colleagues (Forbes et al. 2009. Science 323:776–779) demonstrated that wasps that parasitize apple host races of R. pomonella are genetically differentiated from those that parasitize hawthorn host races of R. pomonella. They also found that wasps that prey on the apple host race of the flies are attracted to odors from apples, whereas wasps that prey on the hawthorn host race are attracted to odors from hawthorns.
Propose an explanation for how genetic differences might have evolved between the wasps that parasitize the two races of R. pomonella.
How might these differences lead to speciation in the wasps?
Question 39
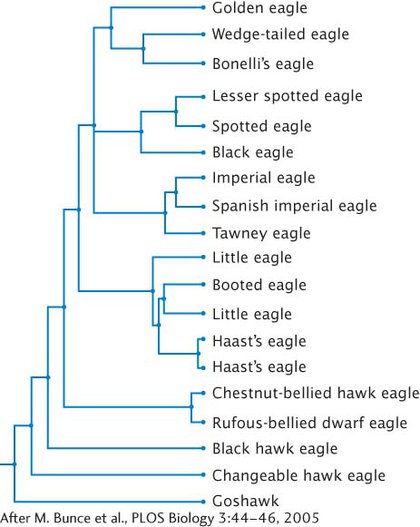
39. Michael Bunce and his colleagues in England, Canada, and the United States extracted and sequenced mitochondrial DNA from fossils of Haast’s eagle, a gigantic eagle that was driven to extinction 700 years ago when humans first arrived in New Zealand (M. Bunce et al. 2005. PLoS Biology 3:44–46). Using mitochondrial DNA sequences from living eagles and from Haast-
Question 40
40.On the basis of the phylogeny of Darwin’s finches shown in Figure 18.12, predict which two species in each of the following groups will be the most similar genetically.
Camarhynchus parvulus, Camarhynchus psittacula, Camarhynchus pallida
Camarhynchus parvulus, Camarhynchus pallida, Platyspiza crassirostris
Geospiza difficilis, Geospiza conirostris, Geospiza scandens
Camarhynchus parvulus, Certhidea fusca, Pinaroloxias inornata
Question 41
41.Assume that one of the genes shown in Table 18.4 showed similar nonsynonymous and synonymous rates of substitution. What might this suggest about the evolution of this gene?
Question 42
42.Based on the information provided in Figure 18.17, do introns or 3′ untranslated regions of a gene have higher rates of nucleotide substitution? Explain why.