Gene Mapping with Recombination Frequencies
Thomas Hunt Morgan and his students developed the idea that physical distances between genes on a chromosome are related to their rates of recombination. They hypothesized that crossover events take place more or less at random up and down the chromosome and that two genes that lie far apart are more likely to undergo a crossover than are two genes that lie close together. They proposed that recombination frequencies could provide a convenient way to determine the order of genes along a chromosome and would give estimates of the relative distances between the genes. Chromosome maps calculated by using the genetic phenomenon of recombination are called genetic maps. In contrast, chromosome maps calculated by using physical distances along the chromosome (often expressed as numbers of base pairs) are called physical maps.
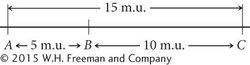
Distances on genetic maps are measured in map units (abbreviated m.u.); one map unit equals a 1% recombination rate. Map units are also called centiMorgans (cM), in honor of Thomas Hunt Morgan. Genetic distances measured with recombination rates are approximately additive: if the distance from gene A to gene B is 5 m.u., the distance from gene B to gene C is 10 m.u., and the distance from gene A to gene C is 15 m.u., then gene B must be located between genes A and C. On the basis of the map distances just given, we can draw a simple genetic map for genes A, B, and C, as shown here:
We could just as plausibly draw this map with C on the left and A on the right:
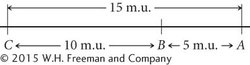
Both maps are correct and equivalent because, with information about the relative positions of only three genes, the most that we can determine is which gene lies in the middle. If we obtained distances to an additional gene, then we could position A and C relative to that gene. An additional gene D, examined through genetic crosses, might yield the following recombination frequencies:
| Gene pair | Recombination frequency (%) |
|---|---|
| A and D | 8 |
| B and D | 13 |
| C and D | 23 |
Notice that C and D exhibit the highest frequency of recombination; therefore, C and D must be farthest apart, with genes A and B between them. Using the recombination frequencies and remembering that 1 m.u. = 1% recombination, we can now add D to our map:
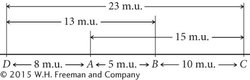
Thus, by doing a series of crosses between pairs of genes, we can construct genetic maps showing the linkage arrangements of a number of genes.
Two points about constructing chromosome maps from recombination frequencies should be emphasized. First, recall that we cannot distinguish between genes on different chromosomes and genes located far apart on the same chromosome. If genes exhibit 50% recombination, the most that can be said about them is that they belong to different linkage groups, either on different chromosomes or far apart on the same chromosome.
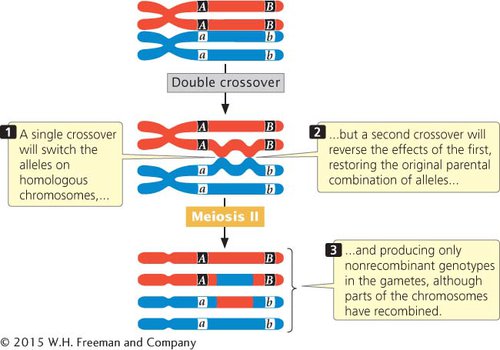
The second point is that a testcross for two genes that are relatively far apart on the same chromosome tends to underestimate the true physical distance because the cross does not reveal double crossovers that might take place between the two genes (Figure 5.10). A double crossover arises when two separate crossover events take place between two loci. (For now, we will consider only double crossovers that take place between two of the four chromatids of a homologous pair—
CONCEPTS
A genetic map provides the order of the genes on a chromosome and the approximate distances from one gene to another based on recombination frequencies. In genetic maps, 1% recombination equals 1 map unit, or 1 centiMorgan. Double crossovers between two genes go undetected, so map distances between distant genes tend to underestimate genetic distances.
 CONCEPT CHECK 3
How does a genetic map differ from a physical map?
Genetic maps are based on rates of recombination; physical maps are based on physical distances.