CONCEPT41.4 Biogeography Also Reflects Geological History
During the Age of Exploration it became clear that spatial patterns in the physical environment were not sufficient by themselves to explain the distributions of organisms. The observations of one scientist in particular suggested an important role for geological history.
Barriers to dispersal affect biogeography
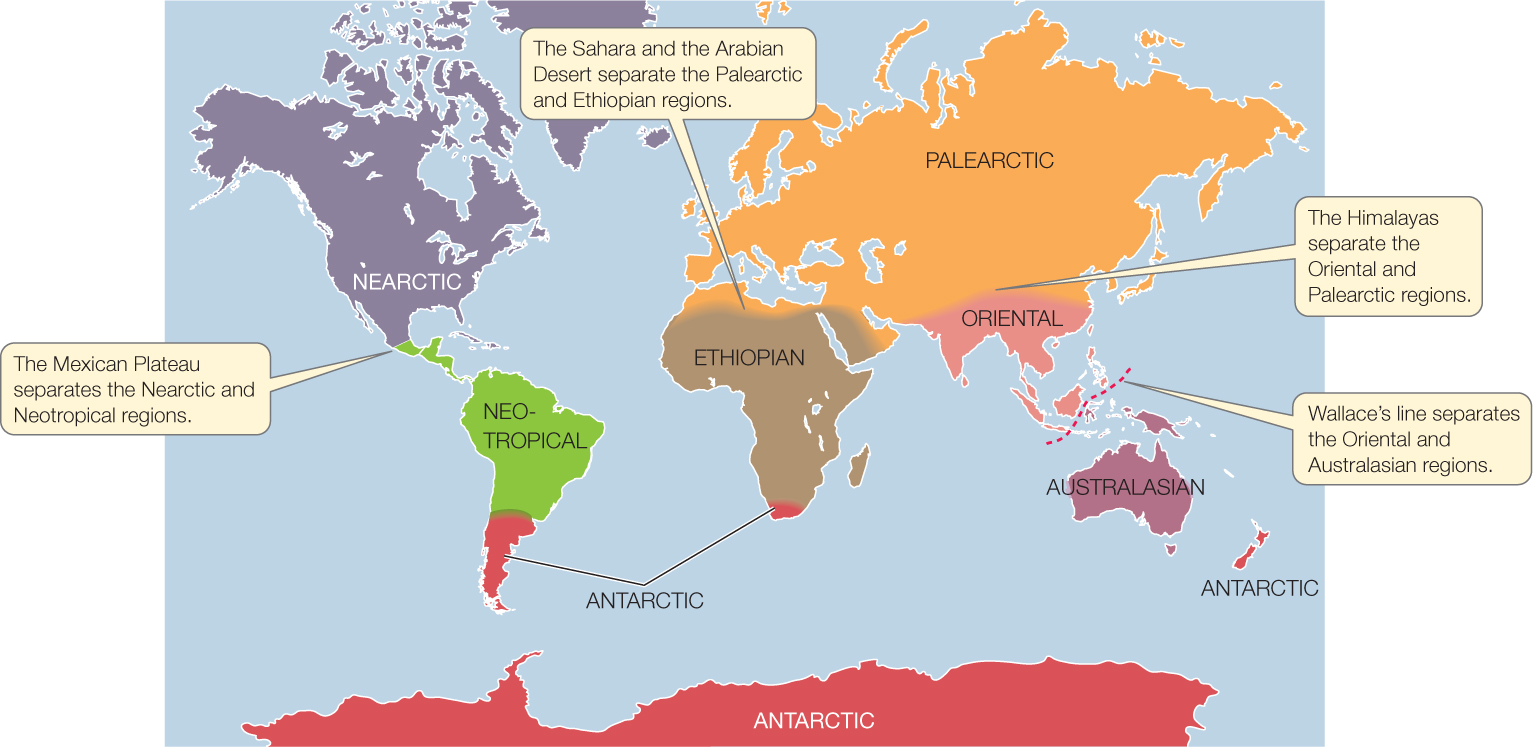
Alfred Russel Wallace—who, along with Charles Darwin, advanced the idea that natural selection could account for the evolution of life’s diversity—first noticed an odd pattern of species distributions during a seven-year exploration of the Malay Archipelago. He observed that dramatically different bird faunas inhabited two neighboring islands, Bali and Lombok. Wallace pointed out that these differences could not be explained by climate or by soil characteristics, because in those respects the two islands are similar. Instead, he suggested that the Malay Archipelago was divided into two distinct halves by a line (now known as Wallace’s line; see Figure 41.14) that follows a deep-water channel separating Bali and Lombok. This channel is so deep that it would have remained full of water—and thus would have been a barrier to the movement of terrestrial animals—even during the glaciations of the Pleistocene era, when sea level dropped more than 100 meters and Bali and the islands to its west were connected to the Asian mainland. As a consequence, the terrestrial faunas on either side of Wallace’s line evolved mostly in isolation over a long period.
858
LINK
The development of the theory of natural selection, and Darwin’s and Wallace’s contributions to it, are discussed in Concept 15.1
The movements of continents account for biogeographic regions
Wallace’s observations of animal distributions worldwide led him to divide Earth’s land masses into six continental-scale areas called biogeographic regions. Each biogeographic region encompasses multiple biomes and contains a distinct assemblage of species, many of which are phylogenetically related. Although Wallace based his regions’ boundaries on animal distributions, schemes based on plants have similar boundaries, and the biogeographic regions as we define them today have changed little from those first proposed by Wallace, despite improvements in our understanding of phylogenetic relationships (FIGURE 41.14).

Many boundaries between biogeographic regions correspond to geographic barriers to movement. These barriers include bodies of water (for terrestrial organisms) and areas with extreme physical environments, such as deserts or high mountain ranges. At Wallace’s line, for example, the Oriental biogeographic region is separated from the Australasian biogeographic region by a deep-water channel.
But not all biogeographic regions are bounded by obvious barriers, and some of them span several continents. It’s not at all clear at first why there are major biogeographic boundaries in Mexico, northern Africa, and Asia; or why the Antarctic region includes the southern tips of South America and Africa as well as New Zealand.
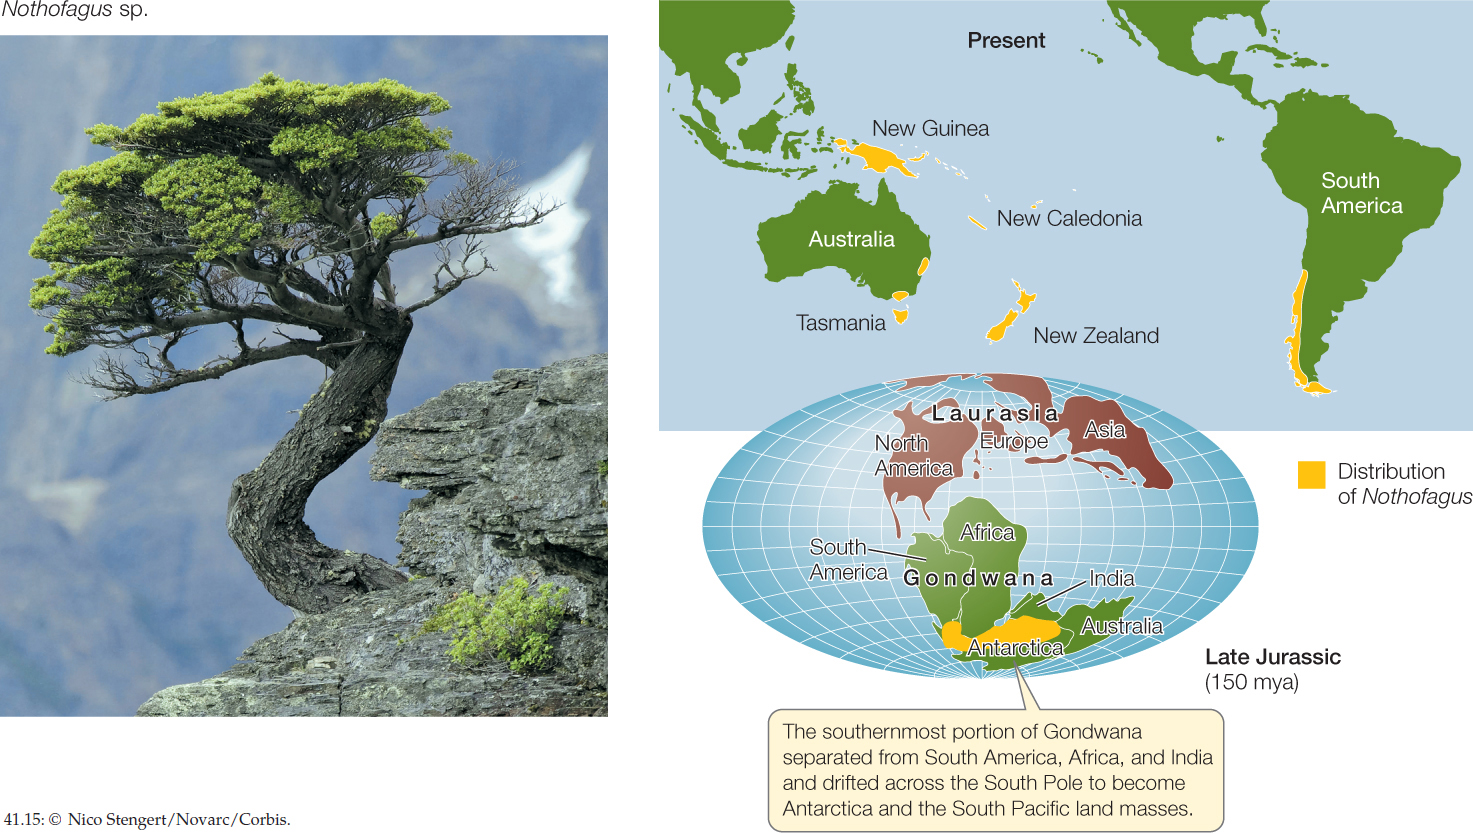
These aspects of biogeographic patterns remained a mystery until the second half of the twentieth century, when the theory of continental drift became widely accepted. Until then, biogeographers could only propose unsatisfactory explanations for the distributions of many organisms, such as rare cross-ocean colonization events or transient appearances of land bridges. Take the distribution of southern beeches (genus Nothofagus), for example. These trees are found in South America, New Zealand, Australia, and on certain islands of the southern Pacific Ocean (FIGURE 41.15). How could their distribution be explained, if not by several separate transoceanic colonization events?

859
Once the movements of the continents were understood, it became clear that they have shaped the distributions of organisms by creating and disrupting dispersal routes. The genus Nothofagus is now thought to have originated on the southern supercontinent Gondwana and to have been carried along when Gondwana broke apart and its fragments drifted to their present locations. Paleontologists have found fossilized Nothofagus pollen dated at over 80 mya in Australia, New Zealand, Antarctica, and South America. This fossil evidence pre-dates the breakup of these portions of Gondwana, suggesting that Nothofagus was once widely distributed across that supercontinent.
LINK
The movements of the continents over geological time are depicted in Figure 18.12 and Animated Tutorial 18.1, and described in Table 18.1; see also Apply the Concept on p. 860
Our understanding of continental drift makes it clear that the major biogeographic regions occupy land masses that have been isolated from one another long enough to allow the organisms present at the time of isolation to undergo independent evolutionary radiations. The northern biogeographic regions (Nearctic and Palearctic) became isolated from the southern regions (Neotropical, Ethiopian, Oriental, Australasian, and Antarctic) during the Jurassic period, about 150 mya, when Pangaea broke into two great land masses, Laurasia to the north and Gondwana to the south (see Figure 41.15). Southern biogeographic regions subsequently became isolated from one another when Gondwana began to break apart, about 130 mya. Neotropical, Ethiopian, Oriental, and Australasian regions were separated approximately 110 mya, and Antarctica became isolated from Australia around 60 mya. At about the same time, the Nearctic and Palearctic regions became isolated by the opening of the Atlantic Ocean, except for a periodic connection via the Bering land bridge between Asia and North America. Thus the biotas of the seven biogeographic regions developed largely in isolation throughout the Tertiary period (about 65 to 2.6 mya), when extensive evolutionary radiations of flowering plants and vertebrates took place.
More recently, continued movements of continents have eliminated some barriers to dispersal and have caused mixing of species that had previously been isolated, referred to as biotic interchange. The collision of India with Asia, for example, formed the Oriental biogeographic region and at the same time caused uplift of the Himalayas. These mountains separate the Oriental and Palearctic regions. Exchange of species between the Ethiopian and Palearctic regions became possible when Africa collided with Eurasia, but the Sahara and Arabian deserts present a climate-based barrier to such exchange. Similarly, mixing of species between the Neotropical and Nearctic regions began when a land bridge formed between South America and North America. During this Great American Interchange, many North American species displaced South American lineages and drove them to extinction. Currently the Mexican Plateau provides a climate-based barrier to the northward dispersal of tropical species that slows their mixing with the communities to the north.
Phylogenetic methods contribute to our understanding of biogeography
As we saw in Chapter 16, taxonomists have developed powerful methods of reconstructing phylogenetic relationships among organisms. Biogeographers use phylogenetic information, in conjunction with the fossil record and geological history, to address questions about how the modern distributions of organisms came about. They begin by superimposing on a phylogenetic tree the geographic area that is or has been occupied by each group. By comparing the sequence and timing of splits (nodes) in the phylogenetic tree with the sequence of separation or connection of geographic areas, biogeographers can determine where a lineage originated and reconstruct the history of its diversification and dispersal. For example, if a phylogenetic split coincides with the appearance of a barrier to dispersal, it is reasonable to conclude that the barrier caused the split by isolating portions of the original range of the ancestral species. If the phylogenetic split comes long before or after a barrier arises, then something else caused portions of the ancestral population to evolve in isolation from one another.
860
Biogeography also reflects geological history
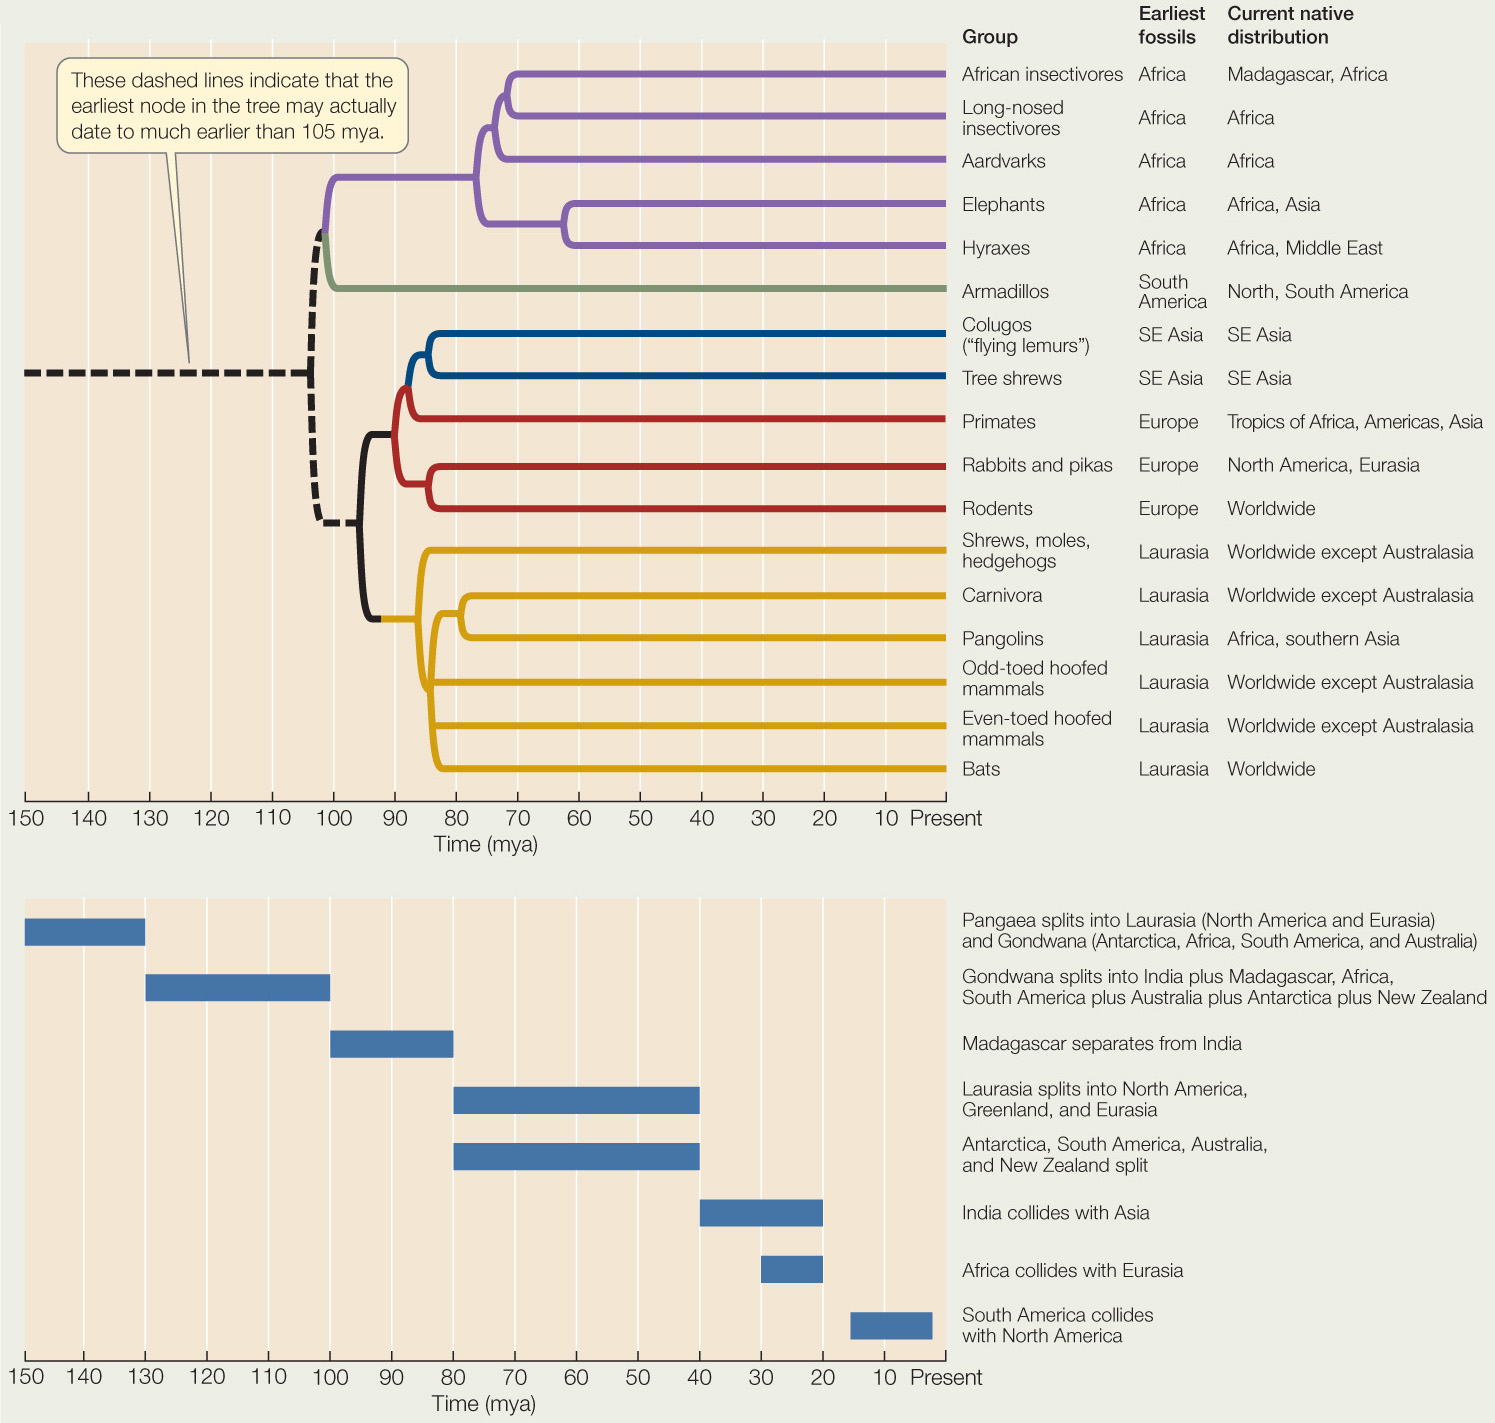
Below is a phylogenetic tree of mammals based on molecular data, accompanied by the original and current distribution of each taxon.a The time course of major continental drift events over the last 150 million years is shown below the tree. Use these data to answer the following questions.
aJ. W. Murphy et al. 2007. Genome Research 17: 413–421.
- Which one node (split) in the tree most clearly corresponds to an event of continental separation?
- Are there groups of mammals that appear to have dispersed to new areas following removal of a barrier to dispersal?

861
CHECKpointCONCEPT41.4
- What is Wallace’s line?
- What kinds of barriers might limit the dispersal of terrestrial species? Of aquatic species?
- Biomes and biogeographic regions are two different concepts that relate to two different fundamental factors that mold the distributions of organisms. Explain.
As we have seen, the makeup of ecological systems on Earth is enormously variable over time and space. Recently, however, this variation has been greatly influenced by the activities of one species: Homo sapiens. How are our activities affecting ecological systems?