GROWTH AND DEVELOPMENT IN CHILDHOOD
GROWTH CHARTS a series of percentile curves illustrating the distribution of selected body measurements (weight, height, body mass index) in children
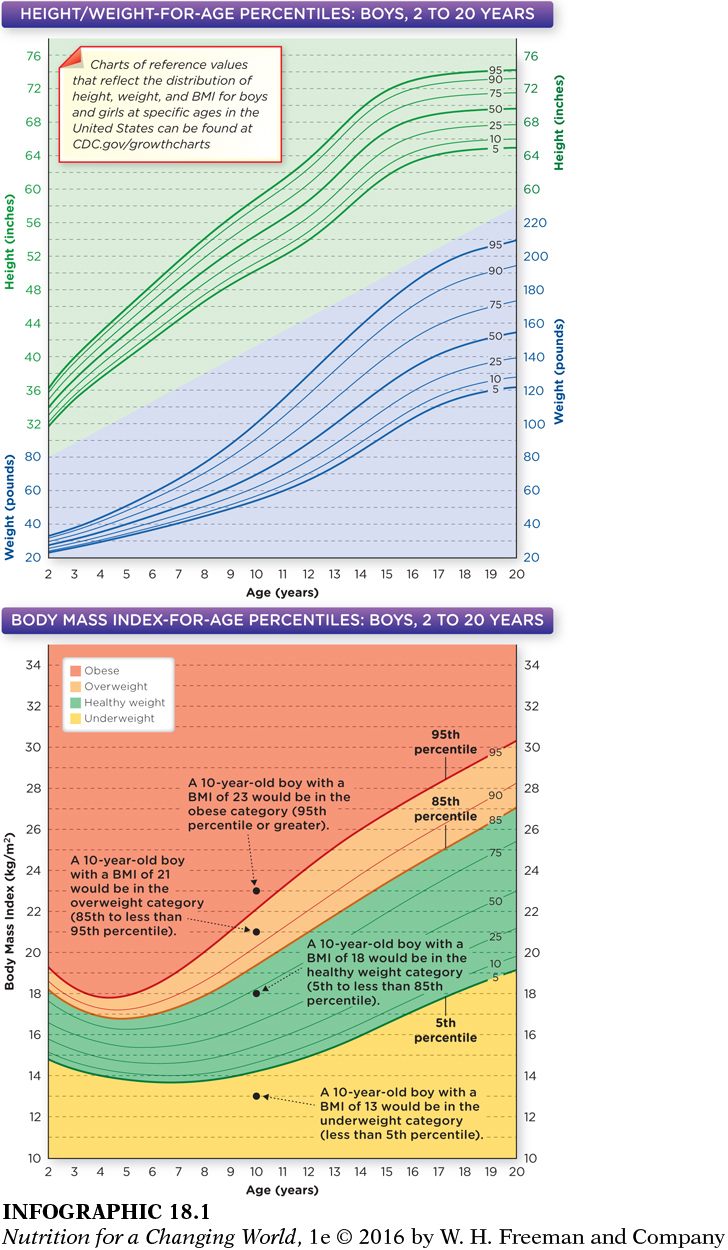
One way for parents and pediatricians to check that children are consuming an adequate diet is by assessing if their rate of growth is appropriate when compared with growth rates expected for U.S. children and adolescents. The CDC’s growth charts serve as references for this comparison. These charts include sex-specific plots of weight-for-age, height-for-age, and body mass index (BMI)-for-age curves for children and adolescents from ages 2 to 20 years. The growth charts present these data as a series of percentile curves that allow one to assess if body size and growth of children are appropriate for their age, or if the child is at risk of undernutrition or obesity. A child whose body weight or height falls at or under the fifth percentile for their age is considered at risk of undernutrition, while those who exceed the 85th or 95th percentile of BMI-for-age are considered to be at risk of being overweight and obese, respectively. To learn more about undernutrition see Chapter 20. (INFOGRAPHIC 18.1)
INFOGRAPHIC 18.1 Tracking Growth for Children Aged 2 to 20 Years Examples of charts used to track height and weight-for-age percentiles, and body mass index-for-age percentiles. A range of clinical growth charts for boys and girls is available at CDC.gov/growthcharts.
GROWTH SPURTS periods of accelerated physical development in children and adolescents with associated changes in height and weight
Growth is extremely rapid in infancy, but it slows in preschool children aged 2 to 5 years. Still, it continues at an impressive rate with an average weight gain of 4.5 to 6.6 pounds and an average growth of 3 to 4 inches each year. School-aged children 6 to 11 years still continue to grow at a steady pace and have occasional growth spurts, periods of accelerated physical development with associated changes in height and weight. Children can vary drastically in height, weight, and build during the school years because of genetics, nutrition, and exercise patterns. That said, on average, children in this age range grow a little more than 2 inches and gain 6.5 pounds per year.

Children have occasional growth spurts, periods of accelerated physical development with associated changes in height and weight. The boys in this photo are brothers ages 14 to 4.
Page 418
PUBERTY dynamic period of development with periodic growth spurts that result in changes in body size, shape, composition, and sex-specific maturation
The end of the elementary school years generally marks the beginning of puberty, a dynamic time of development with periodic growth spurts that result in changes in body size, shape, composition, and sex-specific maturation. Growth and development vary widely during puberty, but the period is almost always associated with significant weight gain—in fact, 50% of adult body weight is typically gained during puberty. In boys, puberty typically begins at age 12 or 13 with an average of 2.5 inches of growth in height and a weight gain of a little more than 11 pounds a year for a span of about 4 years. In girls, puberty usually begins earlier, at age 10 or 11, and girls gain an average of about 2 inches in height and 9 pounds in fat and lean mass each year. Boys and girls often have different nutritional needs during puberty in part because of their different growth trajectories.