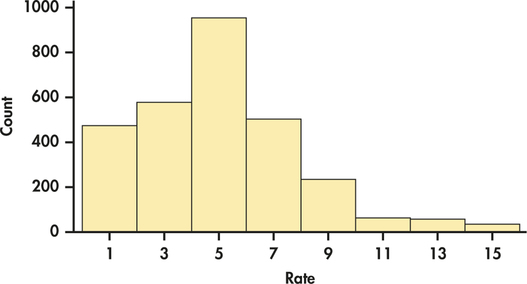
EXAMPLE 1.12 A Histogram of T-Bill Interest Rates
CASE 1.1 To make a histogram of the T-bill interest rates, we proceed as follows.
classes
tbill
Step 1. Divide the range of the interest rates into classes of equal width. The T-bill interest rates range from 0.85% to 15.76%, so we choose as our classes
Be sure to specify the classes precisely so that each case falls into exactly one class. An interest rate of 1.98% would fall into the first class, but 2.00% would fall into the second.
Step 2. Count the number of cases in each class. Here are the counts:
| Class | Count | Class | Count |
|---|---|---|---|
| 473 | 235 | ||
| 575 | 64 | ||
| 951 | 58 | ||
| 501 | 38 |
13
Step 3. Draw the histogram. Mark on the horizontal axis the scale for the variable whose distribution you are displaying. The variable is “interest rate” in this example. The scale runs from 0 to 16 to span the data. The vertical axis contains the scale of counts. Each bar represents a class. The base of the bar covers the class, and the bar height is the class count. Notice that the scale on the vertical axis runs from 0 to 1000 to accommodate the tallest bar, which has a height of 951. There is no horizontal space between the bars unless a class is empty, so that its bar has height zero. Figure 1.6 is our histogram.
