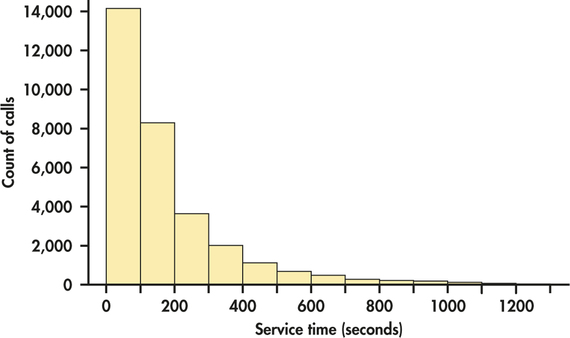
EXAMPLE 1.15 Another Histogram for Customer Service Center Call Lengths
cc
Figure 1.8 is a histogram of the lengths of all 31,492 calls with class boundaries of 0, 100, 200 seconds and so on. Statistical software made this choice as a default option. Notice that the spike representing the very brief calls that appears in Figure 1.7 is covered up in the 0 to 100 seconds class in Figure 1.8.

Figure 1.8: FIGURE 1.8 The default histogram produced by software for the call lengths, Example 1.15. This choice of classes hides the large number of very short calls that is revealed by the histogram of the same data in Figure 1.7.