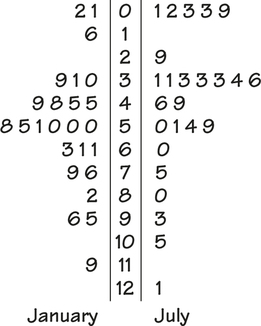
EXAMPLE 1.17 A Back-to-Back Stemplot of T-Bill Interest Rates in January and July
tbilljj
CASE 1.1 For this back-to-back stemplot, we took a sample of 25 January T-bill interest rates and another sample of 25 July T-bill interest rates. We round the rates to one digit after the decimal. The plot is shown in Figure 1.10. The stem with the largest number of entries is 5 for January and 3 for July. The rates for January appear to be somewhat larger than those for July. In the next section we learn how to calculate numerical summaries that will help us to make the comparison.
FIGURE 1.10 Back-to-back stemplot to compare T-bill interest rates in January and July, Example 1.17.

[Leave] [Close]