EXAMPLE 1.19 IQ Scores of Fifth-Grade Students
iq
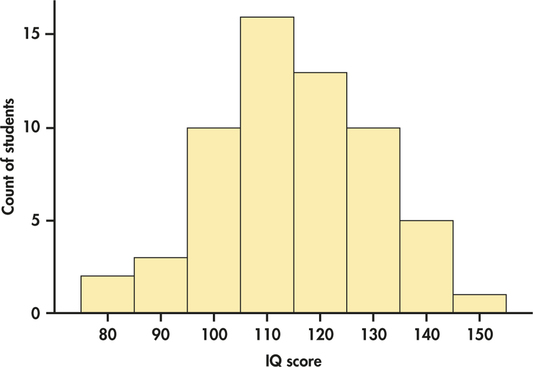
Figure 1.11 displays a histogram of the IQ scores of 60 fifth-grade students. There is a single peak around 110, and the distribution is approximately sym-IQ metric. The tails decrease smoothly as we move away from the peak. Measures such as this are usually constructed so that they have distributions like the one shown in Figure 1.11.
19

Figure 1.11: FIGURE 1.11 Histogram of the IQ scores of 60 fifth-grade students, Example 1.19.