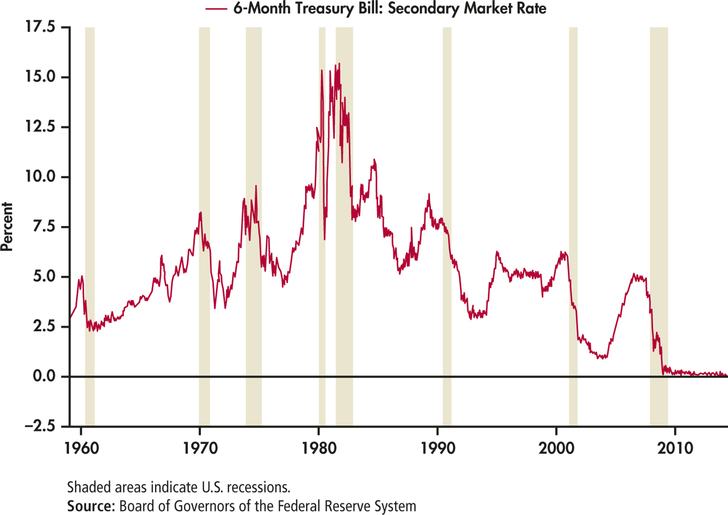
EXAMPLE 1.20 A Time Plot for T-Bill Interest Rates
CASE 1.1 The website of the Federal Reserve Bank of St. Louis provided a very interesting graph of T-bill interest rates.10 It is shown in Figure 1.12. A time plot shows us the relationship between two variables, in this case interest rate and the auctions that occurred at four-week intervals. Notice how the Federal Reserve Bank included information about a third variable in this plot. The third variable is a categorical variable that indicates whether or not the United States was in a recession. It is indicated by the shaded areas in the plot.

Figure 1.12: FIGURE 1.12 Time plot for T-bill interest rates, Example 1.20.