EXAMPLE 1.21 The Distribution of Business Start Times
tts24
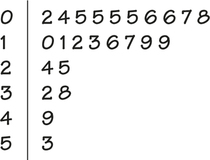
CASE 1.2 The stemplot in Figure 1.13 shows us the shape, center, and spread of the business start times. The stems are tens of days, and the leaves are days. The distribution is skewed to the right with a very long tail of high values. All but six of the times are less than 20 days. The center appears to be about 10 days, and the values range from 2 days to 53 days. There do not appear to be any outliers.

Figure 1.13: FIGURE 1.13 Stemplot for sample of 24 business start times, Example 1.21.