EXAMPLE 1.25 Service Center Call Lengths
cc80
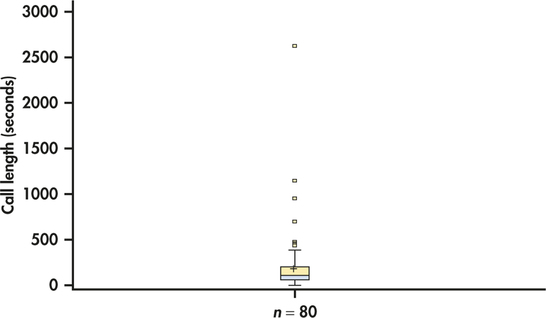
Table 1.1 (page 14) displays the customer service center call lengths for a random sample of 80 calls that we discussed in Example 1.13 (page 13). The five-number summary for these data is 1.0, 54.4, 103.5, 200, 2631. The distribution is highly skewed. The mean is 197 seconds, a value that is very close to the third quartile. The boxplot is displayed in Figure 1.14. The skewness of the distribution is the major feature that we see in this plot. Note that the mean is marked with a “+” and appears very close to the upper edge of the box.

Figure 1.14: FIGURE 1.14 Boxplot for sample of 80 service center call lengths, Example 1.25.