EXAMPLE 1.41 T-Bill Interest Rates Are Not Normal
CASE 1.1
tbill
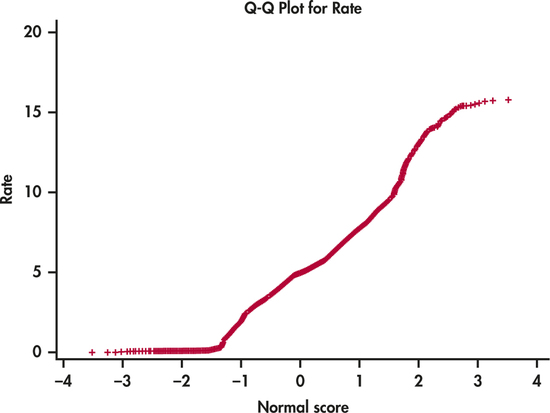
We made a histogram for the distribution of interest rates for T-bills in Example 1.12 (page 12). A Normal quantile plot for these data is shown in Figure 1.29. This plot shows some interesting features of the distribution. First, in the central part, from about to , the points fall approximately on a straight line. This suggests that the distribution is approximately Normal in this range. In both the lower and the upper extremes, the points flatten out. This occurs at an interest rate of around 1% for the lower tail and at 15% for the upper tail.
53

Figure 1.31: FIGURE 1.29 Normal quantile plot for the T-bill interest rates, Example 1.41. These data are not approximately Normal.