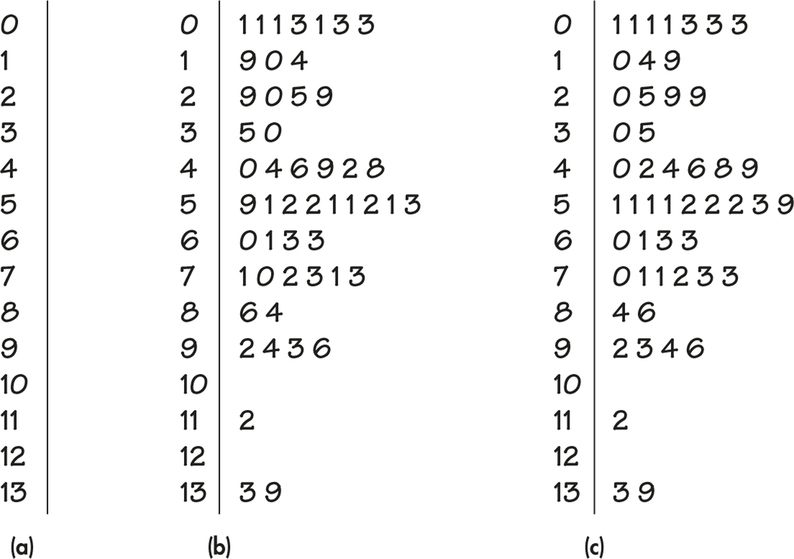
Figure 1.9: FIGURE 1.9 Steps in creating a stemplot for the sample of 50 T-bill interest rates, Example 1.16. (a) Write the stems in a column, from smallest to largest, and draw a vertical line to their right. (b) Add each leaf to the right of its stem. (c) Arrange each leaf in increasing order out from its stem.