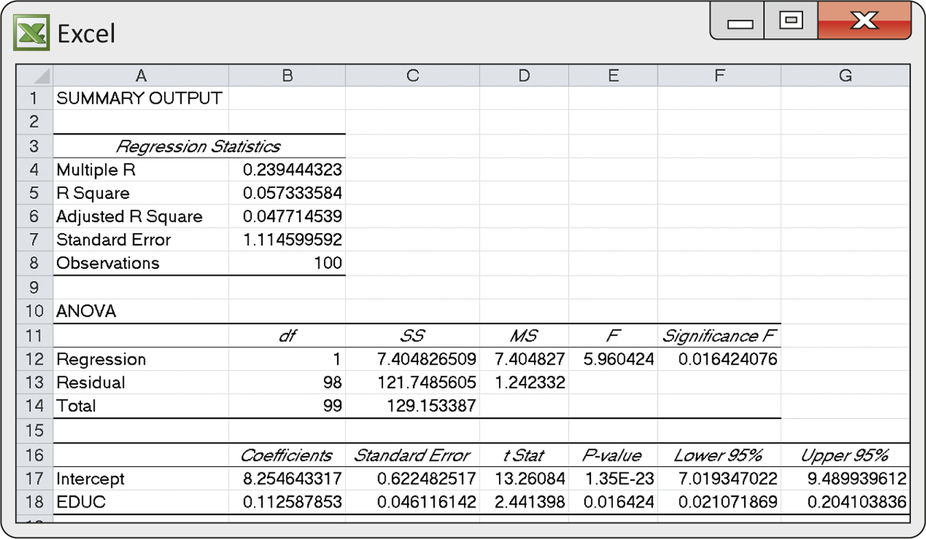
EXAMPLE 10.12 ANOVA for Entrepreneurs’ Log Income
entre
CASE 10.1 Figure 10.18 repeats Figure 10.5. It is the Excel output for the regression of log income on years of education (Case 10.1). The three terms in the analysis of variance equation appear under the “SS” heading. SS stands for sum of squares, reflecting the fact that each of the three terms is a sum of squared quantities. You can read the output as follows:
total variation iny=variation along the line+variation about the linetotal SS=regression SS+residual SS129.1534=7.4048+121.7486
sum of squares

The proportion of variation in log incomes explained by regressing years of education is
r2=Regression SSTotal SS=7.4048129.1534=0.0573
This agrees with the “R Square” value in the output. Only about 6% of the variation in log incomes is explained by the linear relationship between log income and years of education. The rest is variation in log incomes among entrepreneurs with similar levels of education.