EXAMPLE 10.4 Log Income and Years of Education
entre
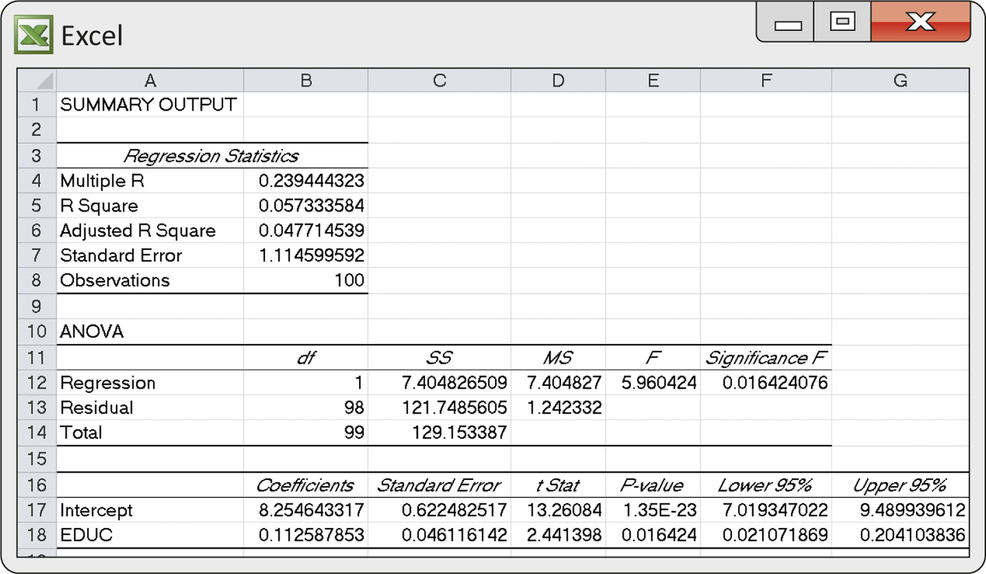
CASE 10.1 Figure 10.5 displays Excel output for the regression of log income (LOGINC) on years of education (EDUC) for our sample of 100 entrepreneurs in the United States. In this output, we find the correlation r=0.2394 and the squared correlation that we used in Example 10.2, along with the intercept and slope of the least-squares line. The regression standard error s is labeled simply “Standard Error.”

The three parameter estimates are
b0=8.254643317b1=0.112587853s=1.114599592
After rounding, the fitted regression line is
ˆy=8.2546+0.1126x
As usual, we ignore the parts of the output that we do not yet need. We will return to the output for additional information later.

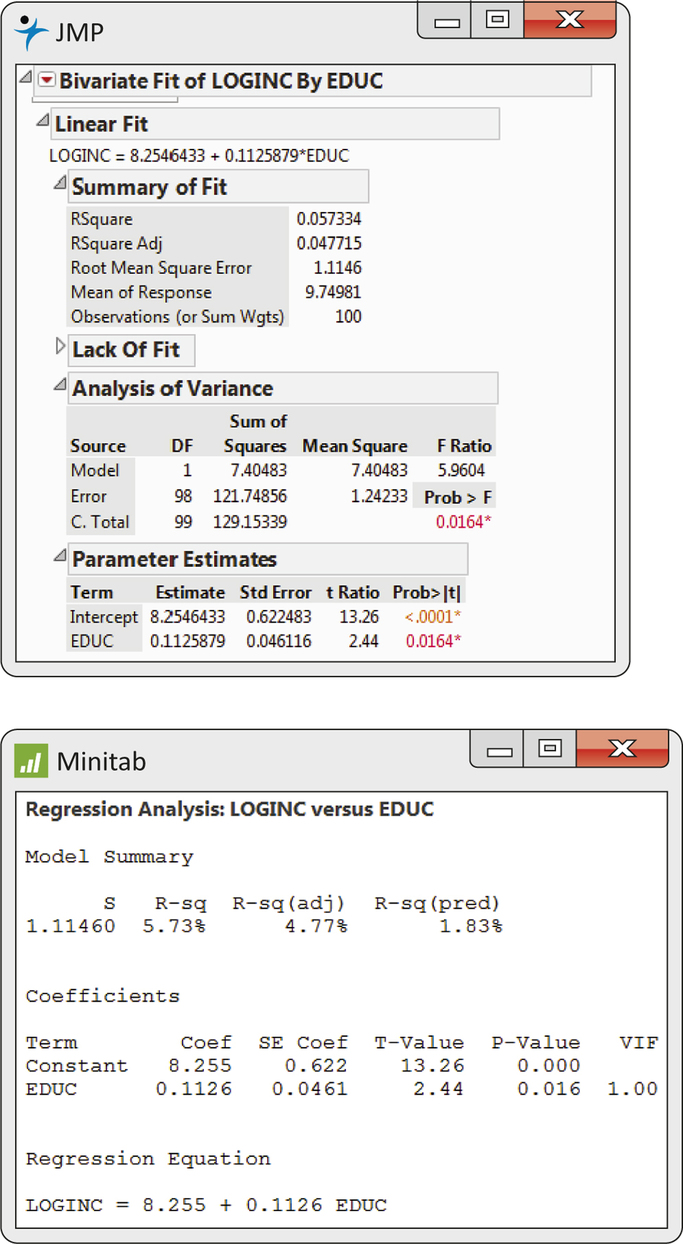
Figure 10.6 shows the regression output from two other software packages. Although the formats differ, you should be able to find the results you need. Once you know what to look for, you can understand statistical output from almost any software.