EXAMPLE 10.8 Comparing the Two Intervals
entre
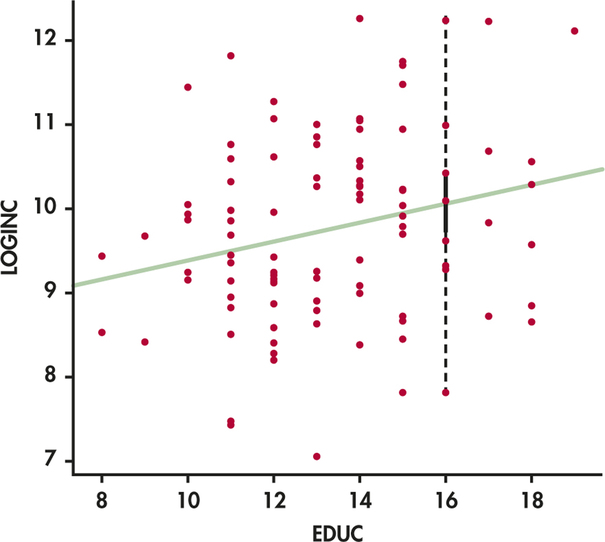
CASE 10.1 Figure 10.13 displays the data, the least-squares line, and both intervals. The confidence interval for the mean is solid. The prediction interval for Alexander’s individual log income level is dashed. You can see that the prediction interval is much wider and that it matches the vertical spread of entrepreneurs’ log incomes about the regression line.

Figure 10.13: FIGURE 10.13 Confidence interval for mean log income (solid) and prediction interval for individual log income (dashed) for an entrepreneur with 16 years of education. Both intervals are centered at the predicted value from the least-squares line, which is for .