Question 10.23
10.23 Looking at age and income.
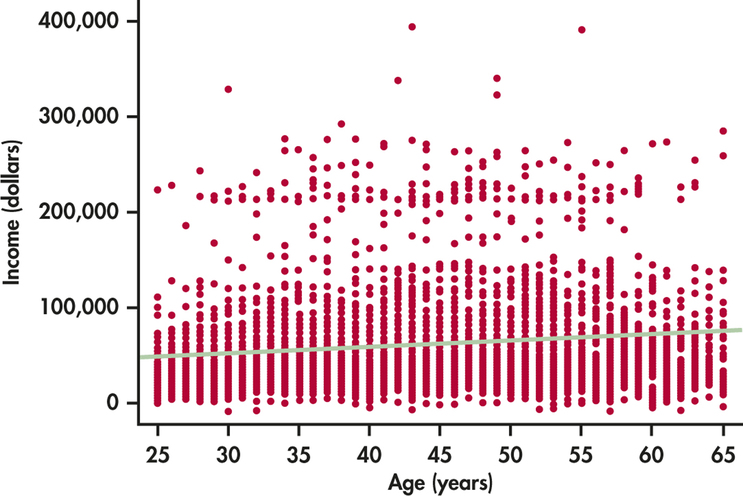
The scatterplot in Figure 10.11 has a distinctive form.
- Age is recorded as of the last birthday. How does this explain the vertical stacks in the scatterplot?
- Give some reasons older men in this population might earn more than younger men. Give some reasons younger men might earn more than older men. What do the data show about the relationship between age and income in the sample? Is the relationship very strong?
- What is the equation of the least-squares line for predicting income from age? What specifically does the slope of this line tell us?

Figure 10.11: FIGURE 10.11 Scatterplot of income against age for a random sample of 5712 men aged 25 to 65, Exercises 10.23 to 10.25.
10.23
(a) All ages are reported as integers forming the stacks. (b) Answers will vary. Older men could have more experience; younger men could have more recent education. The data show that there is no relationship between age and income for men (or a very weak one). (c) . For each 1 year a man gets older, his predicted income goes up by $892.11.
inage