For Exercises 10.39 and 10.40, see page 514.
Many of the following exercises require use of software that will calculate the intervals required for predicting mean response and individual response.
Question 10.40
10.40 Predicting the return on Treasury bills.
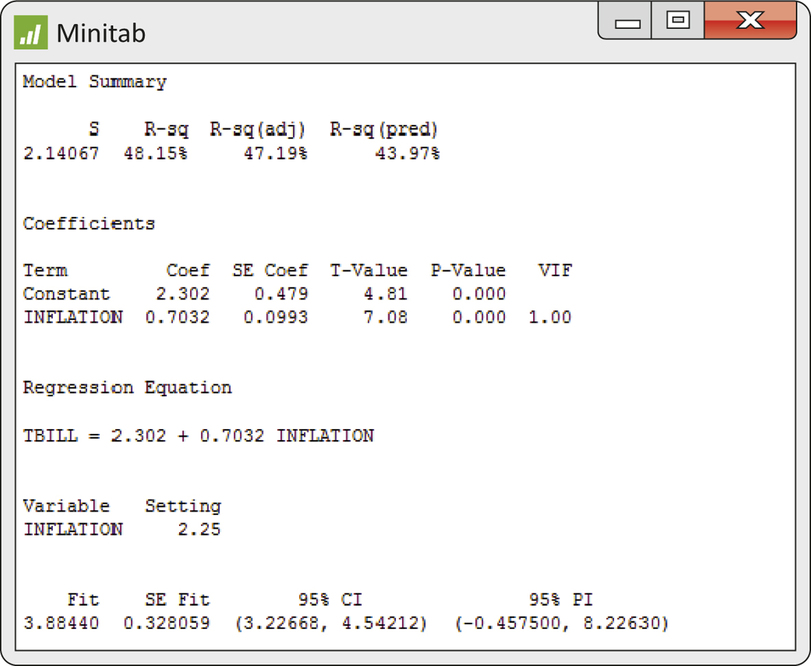
Table 10.1 (page 498) gives data on the rate of inflation and the percent return on Treasury bills for 55 years. Figures 10.9 and 10.10 analyze these data. You think that next year’s inflation rate will be 2.25%. Figure 10.16 displays part of the Minitab regression output, including predicted values for . The basic output agrees with the Excel results in Figure 10.10.
- Verify the predicted value from the equation of the leastsquares line.
- What is your 95% interval for predicting next year’s return on Treasury bills?

Figure 10.16: FIGURE 10.16 Minitab output for the regression of the percent return on Treasury bills against the rate of inflation the same year, Exercise 10.40. The output includes predictions of the T-bill return when the inflation rate is 2.25%.
515

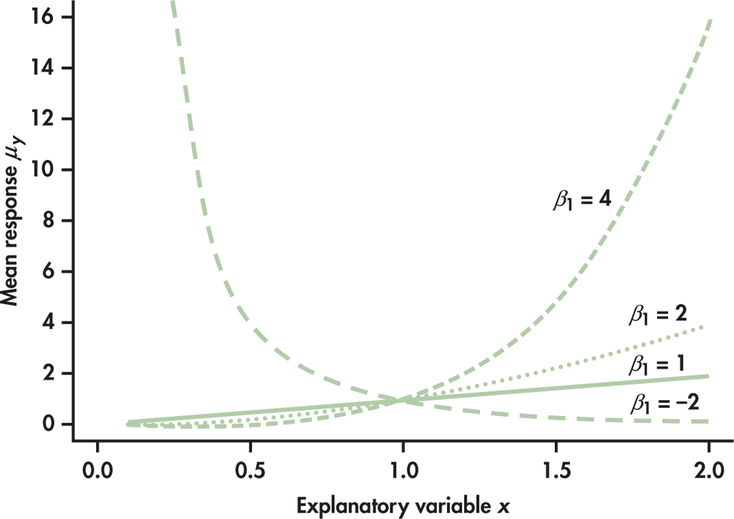
Figure 10.17: FIGURE 10.17 The nonlinear model includes these and other relationships between the explanatory variable and the mean response.