Question 10.75
10.75 College debt versus adjusted in-state costs.
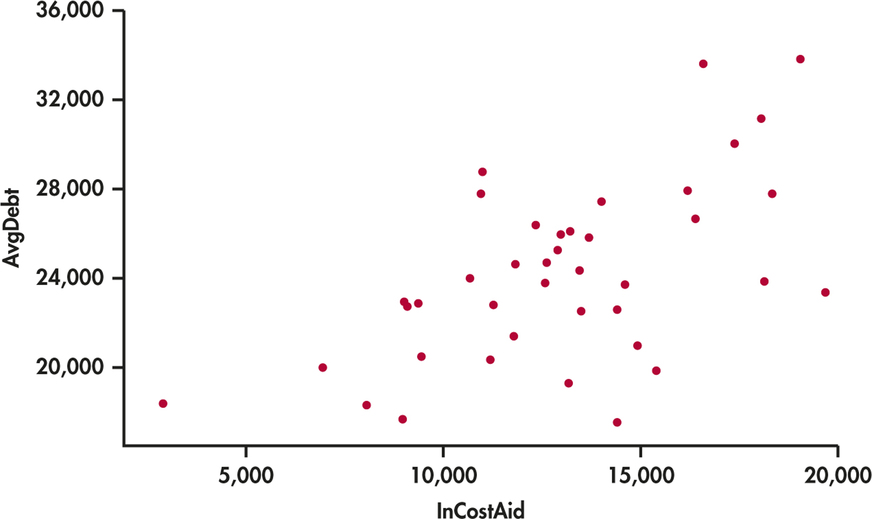
Kiplinger’s “Best Values in Public Colleges” provides a ranking of U.S. public colleges based on a combination of various measures of academics and affordability.19 We’ll consider a random collection of 40 colleges from Kiplinger’s 2014 report and focus on the average debt in dollars at graduation (AvgDebt) and the in-state cost per year after need-based aid (InCostAid).
bestval
- A scatterplot of these two variables is shown in Figure 10.20. Describe the relationship. Are there any possible outliers or unusual values? Does a linear relationship between InCostAid and AvgDebt seem reasonable?
- Based on the scatterplot, approximately how much does the average debt change for an additional $1000 of annual cost?
- Colorado School of Mines is a school with an adjusted in-state cost of $22,229. Discuss the appropriateness of using this data set to predict the average debt for this school.

10.75
(a) The data are weakly linear and positive. There is one college with a very low InCostAid value. A linear model seems appropriate. (b) Answers will vary because it is difficult to tell from the scatterplot. The actual value is around $650. (c) Because the Colorado School of Mines instate cost falls outside the range for our dataset, it would be extrapolation and likely yield an incorrect prediction.