EXAMPLE 11.10 Distribution of the Residuals
bbcg30
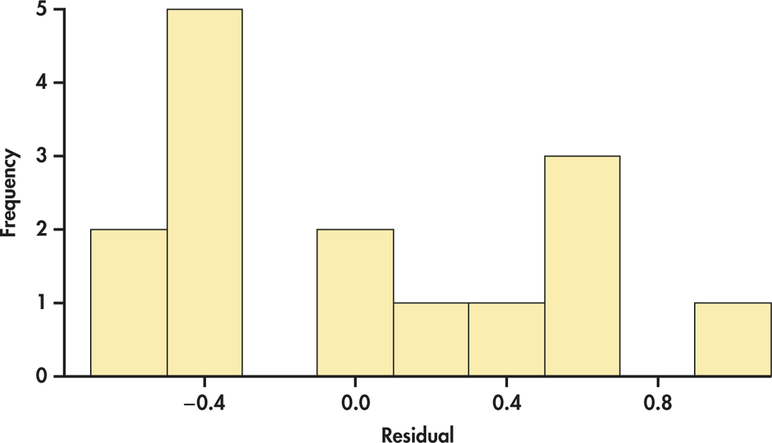
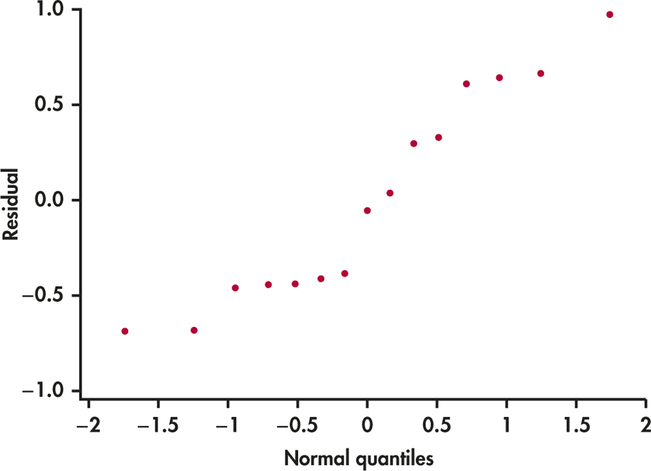
CASE 11.1 Figure 11.7 is a histogram of the residuals. The units are billions of dollars. The distribution does not look symmetric but does not have any outliers. The Normal quantile plot in Figure 11.8 is somewhat linear. Given the small sample size, these plots are not extremely out of the ordinary. Similar to simple linear regression, inference is robust against moderate lack of Normality, so we’re just looking for obvious violations. There do not appear to be any here.
542

Figure 11.7: FIGURE 11.7 Histogram of residuals, Example 11.10.

Figure 11.8: FIGURE 11.8 Normal quantile plot of residuals, Example 11.10.