EXAMPLE 11.11 Residual Plots
bbcg30
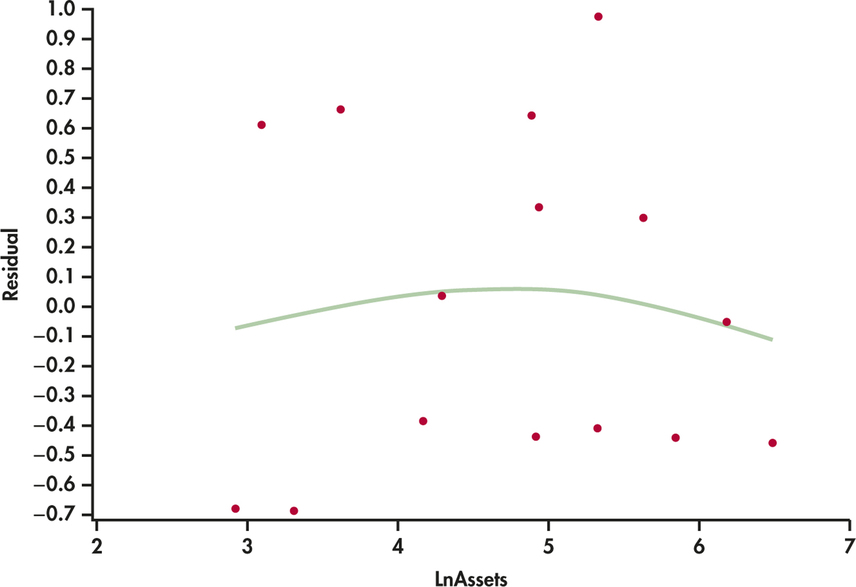
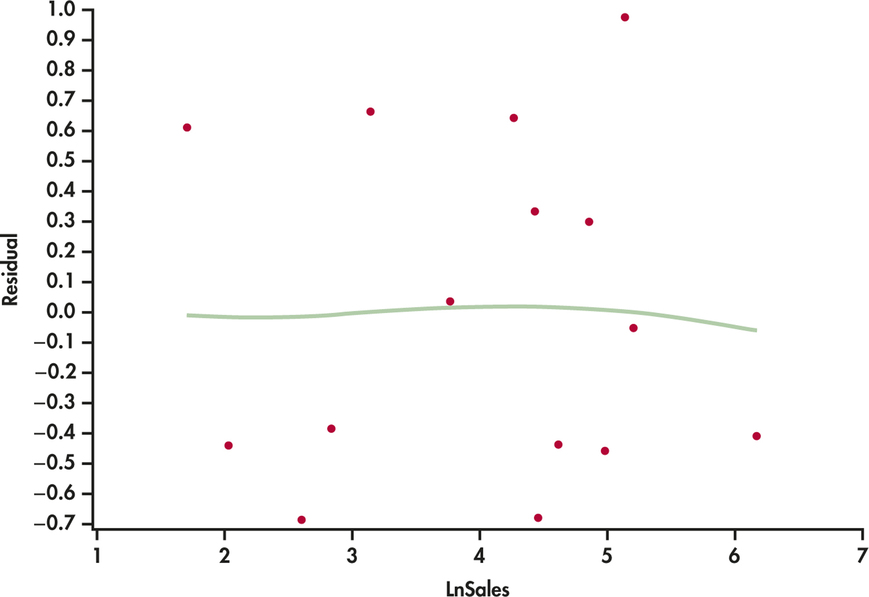
CASE 11.1 The residuals are plotted versus log assets in Figure 11.9 and versus log sales in Figure 11.10. In both cases, the residuals appear reasonably randomly scattered above and below zero. The smoothed curves suggest a slight curvature in the pattern of residuals versus log assets but not to the point of considering further analysis. We’re likely seeing more in the data than there really is given the small sample size.
543

Figure 11.9: FIGURE 11.9 Plot of residuals versus log assets, Example 11.11.

Figure 11.10: FIGURE 11.10 Plot of residuals versus log sales, Example 11.11.