EXAMPLE 11.18 Regression of Price on Square Feet
homes04
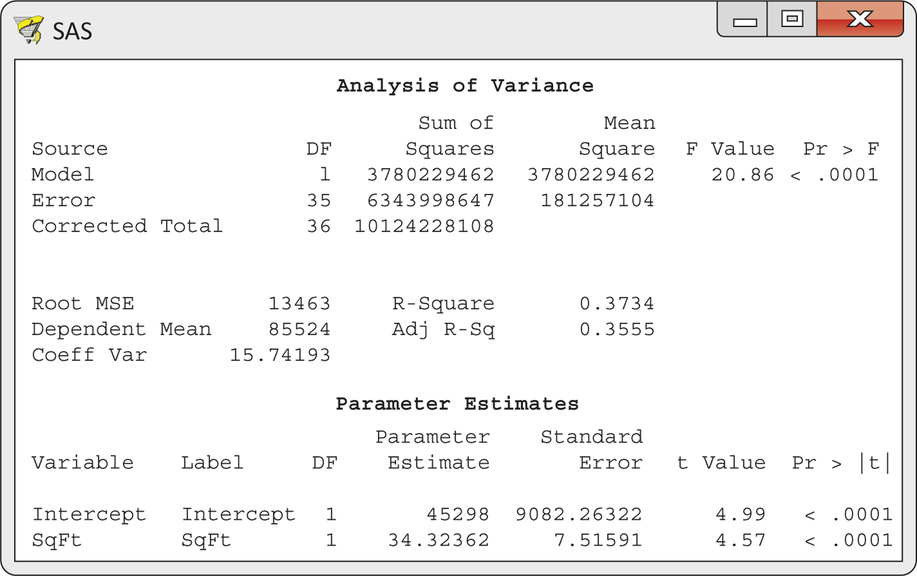
CASE 11.3 Figure 11.14 gives the regression output. The number of degrees of freedom in the "Corrected Total’’ line in the ANOVA table is 36. This is correct for the homes that remain after we excluded seven of the original 44. The fitted model is
The coefficient for SqFt is statistically significant (, , ). Each additional square foot of area raises selling prices by $34.32 on the average. From the , we see that 37.3% of the variation in the home prices is explained by a linear relationship with square feet. We hope that multiple regression will allow us to improve on this first attempt to explain selling price.

Figure 11.14: FIGURE 11.14 Linear regression output for predicting price using square feet, Example 11.18.